“It ain’t what you don’t know that gets you into trouble. It’s what you know for sure that just ain’t so.”
Mark Twain
Are the numbers real?
Trainee due diligence practitioners learn first to ask, “Are the numbers real?” Only upon affirming their authenticity do they proceed to interpret, “What are the numbers telling me?” I feel, this discerning approach is relevant, now more than ever, in our broader quest for truth in the wider world.
Ever since Covid struck, it feels like we’ve been obsessing about statistics, the results of which have been driving business and consumer sentiment. The sequence of data we have been fixated on has transitioned something like this:
2020 – 2021
- Covid case counts
- Covid mortality stats – [when case counts became unreliable, as we recognised people were not testing]
- Excess mortality stats – [when covid mortality stats were found to be unreliable, as it was unclear if the mortality was actually Covid driven or “normal”]
2022 – Present
- Consumer Price Inflation
- Multiple types of revised inflation metrics (e.g. Super Core CPI, Median CPI, Trim Median CPI, PPI, Super Core PPI, etc) – [A cynic might suggest this happened when standard CPI was found to be not declining as fast as politicians and central banks wanted]
2024 (my guess)
- Unemployment Statistics – [my view is people will look to unemployment data as a true signal of economic conditions, as inflation and GDP stats are found to be unreliable. In fact the Fed has already acknowledged this.]
The issue is that many of the major reported statistics and narratives around them, have consistently proven to be wrong.
Narrative chaos
Examples of – in my opinion – incorrect data and misleading narratives include:
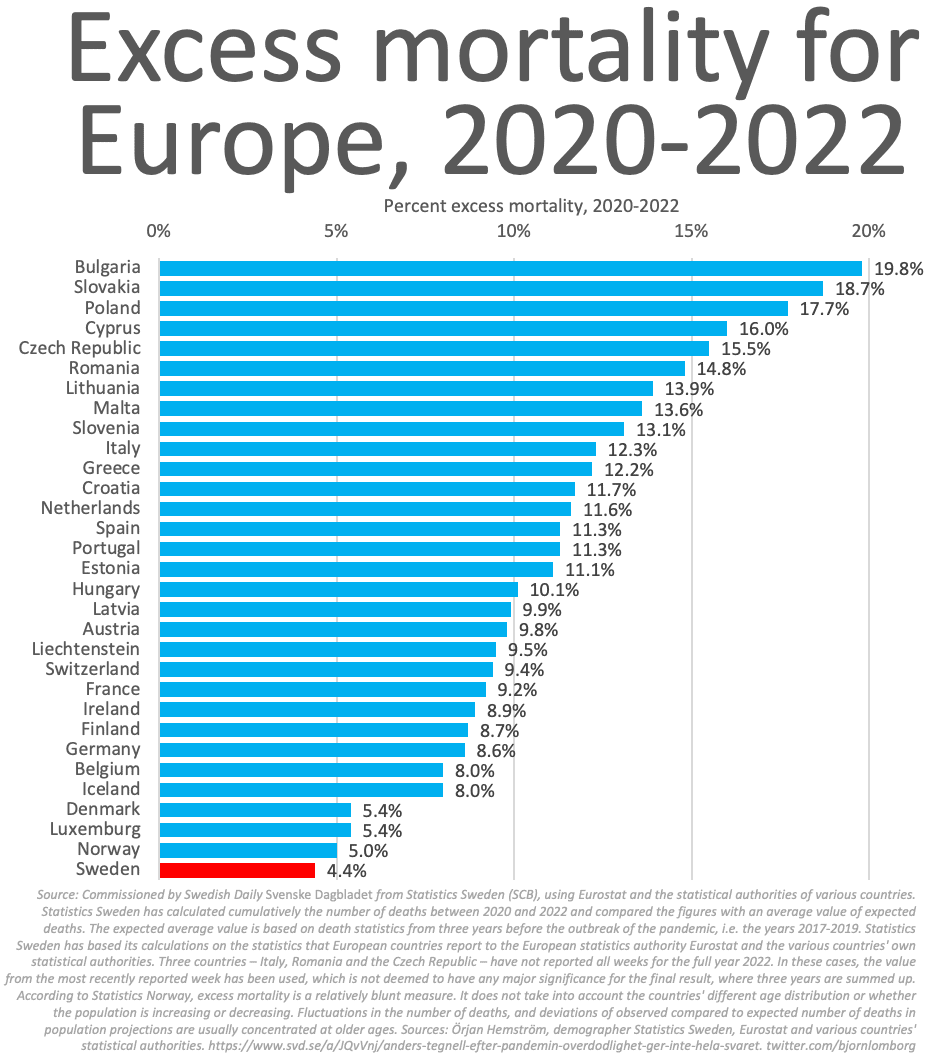
- Sweden’s approach to lockdowns
- The original data on excess mortality in Stockholm was it was that it was bad, and the narrative was Sweden’s relaxed approach to lockdowns was a disaster, and a lesson to other countries not to do this.
- The current data on excess mortality across Europe shows Sweden had the lowest excess mortality from 2020 – 2022 (ref 1). I.e. Sweden’s approach was the right one and most of the rest of the world was mistaken.
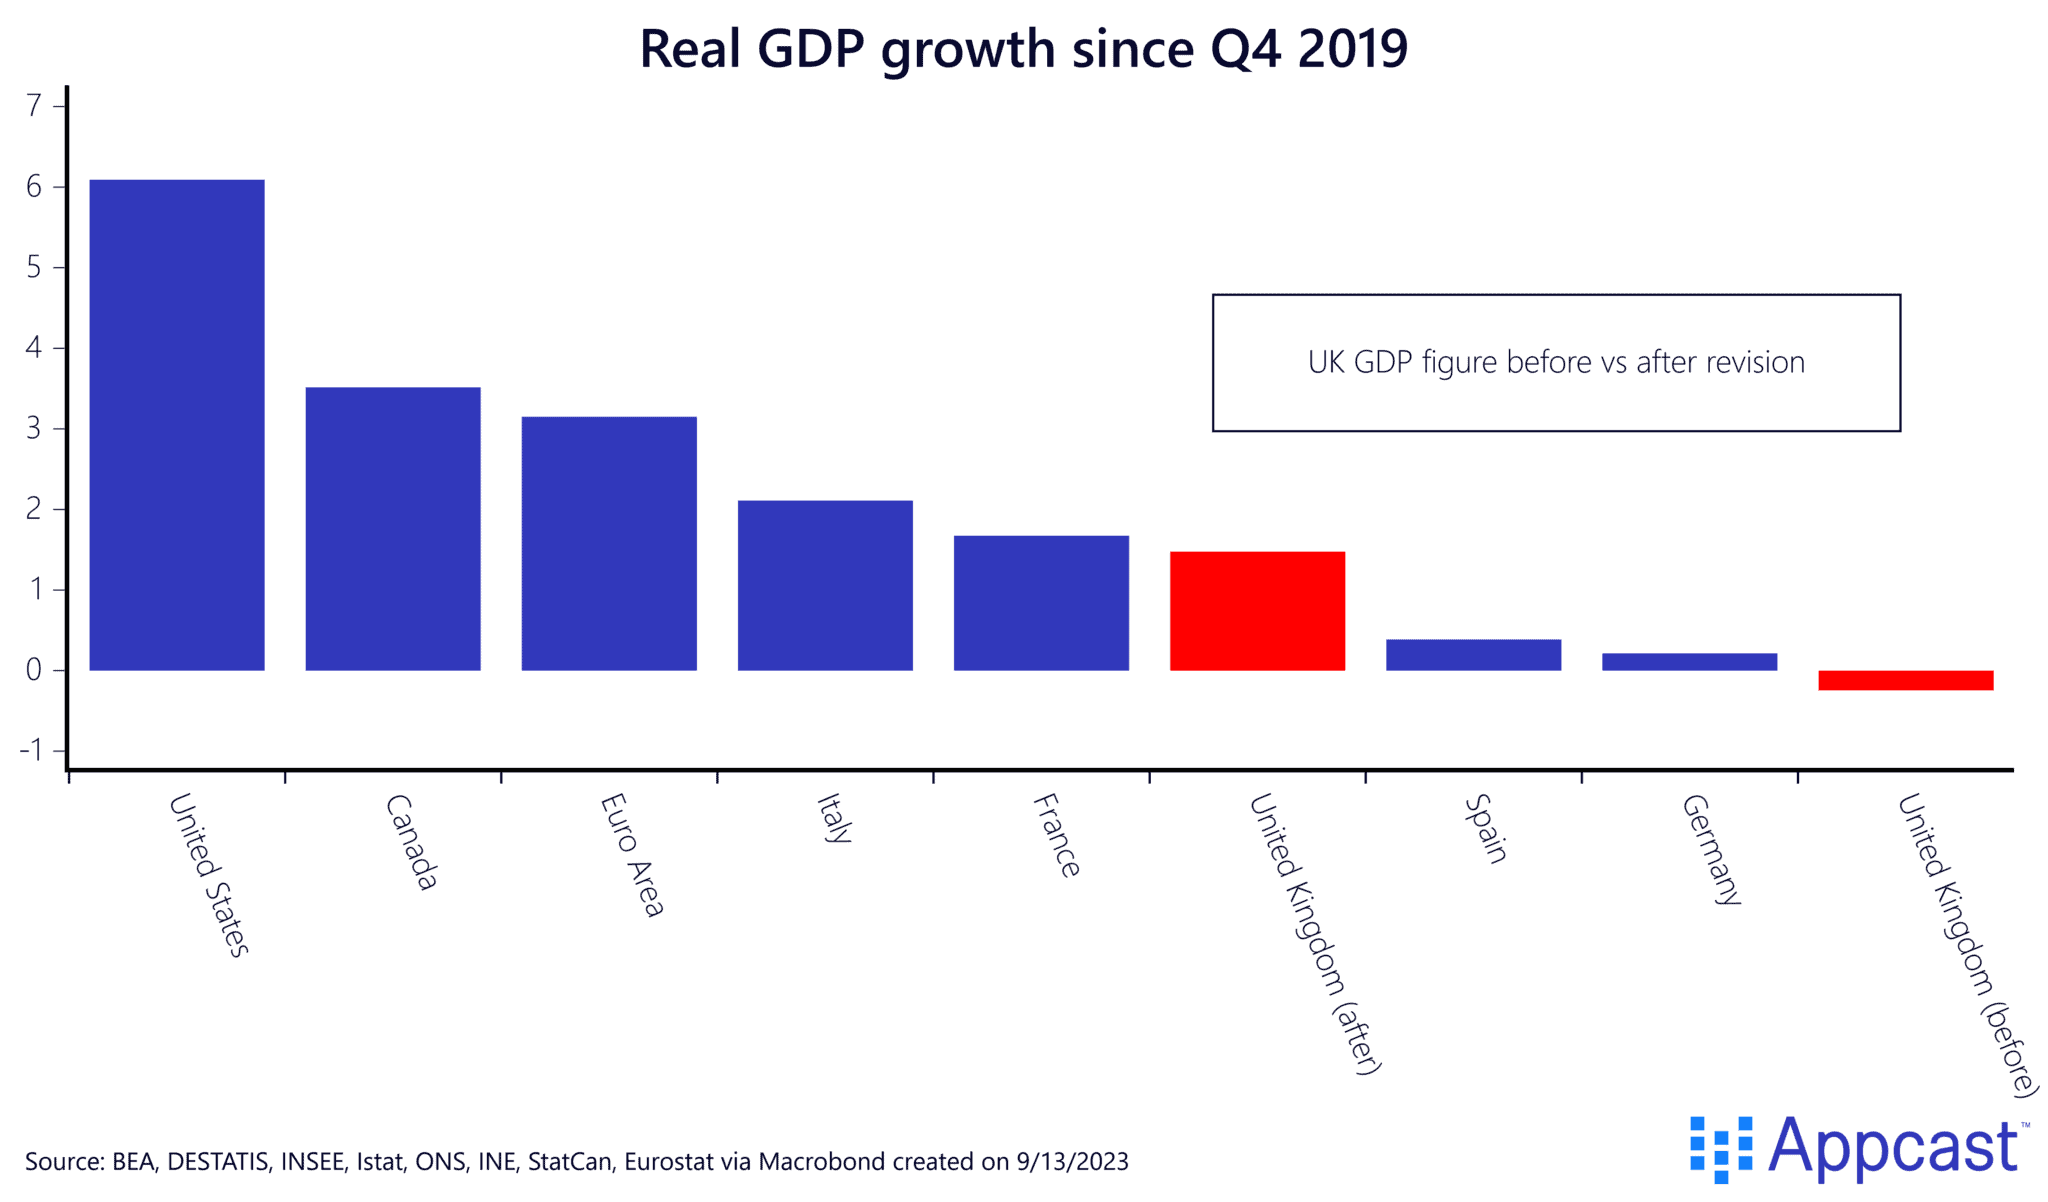
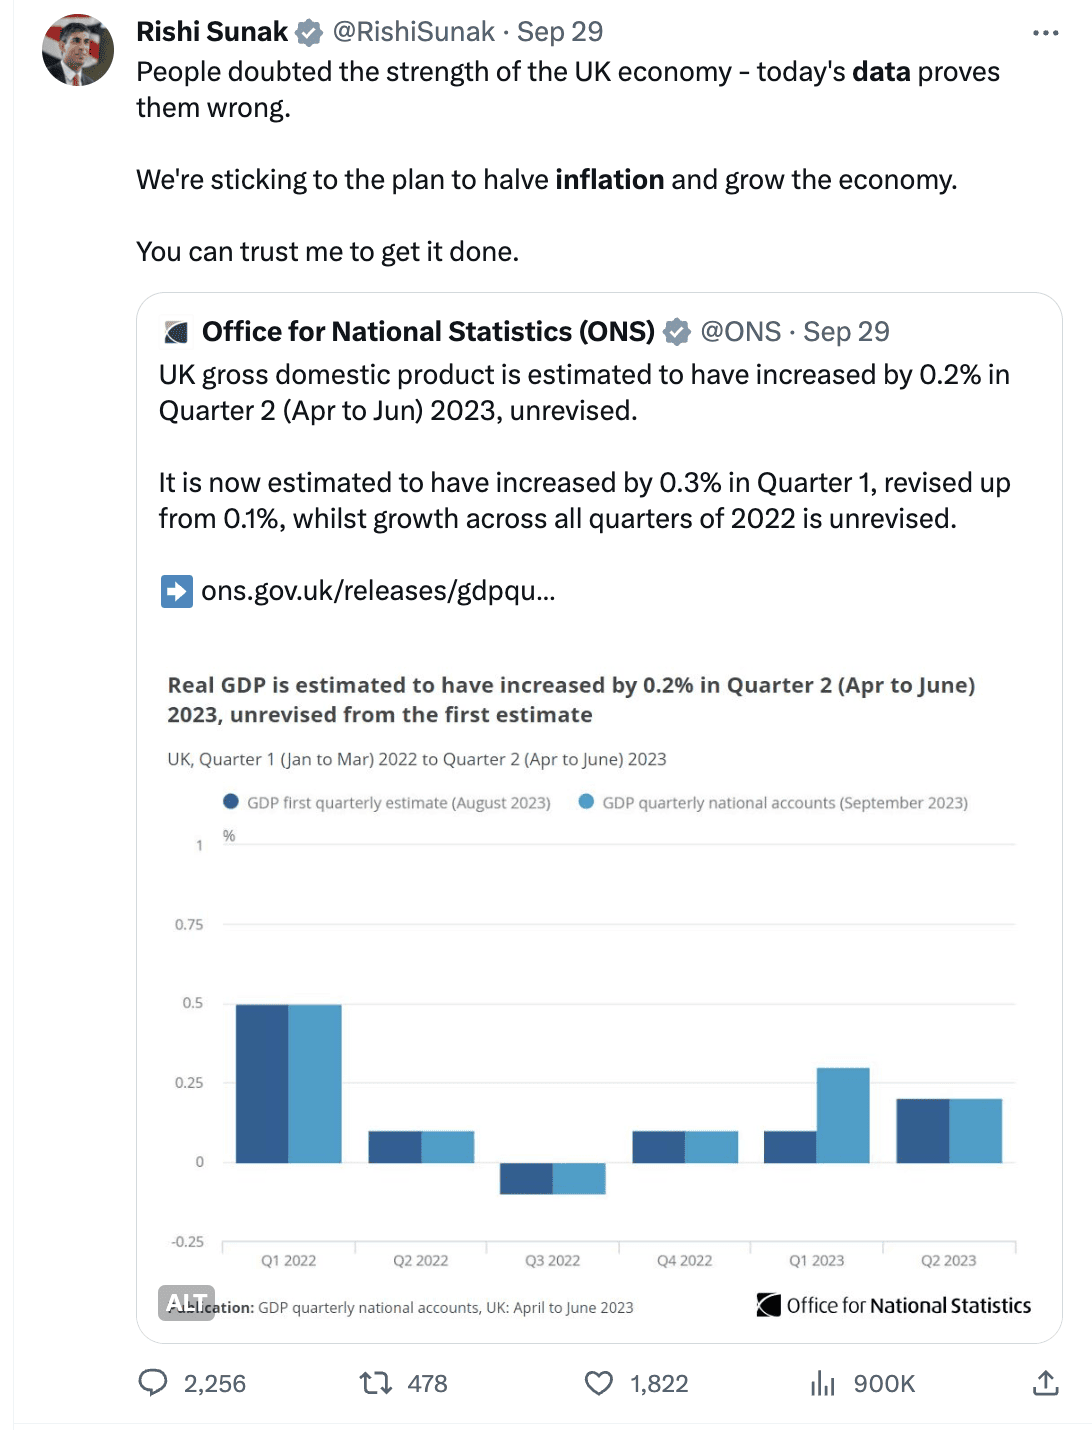
- UK GDP growth data
- The original data was the UK’s GDP from 4Q 2019 was the lowest across the Eurozone, with the narrative/ blame attributed to Brexit and government policy.
- The revised data shows the UK on a par with France and Italy, and way ahead of Germany and Spain (ref 2, ref 8).
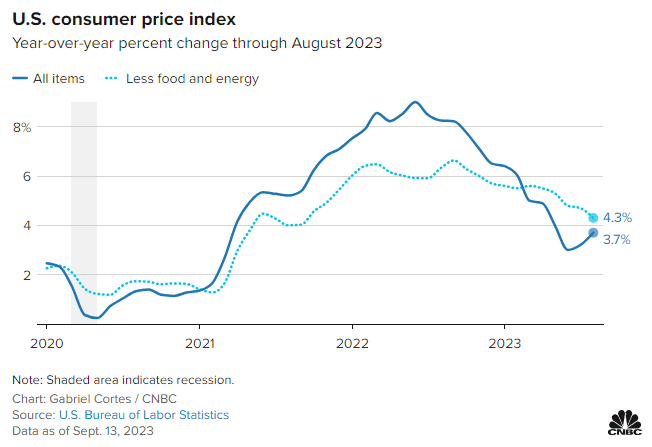
- US Inflation data
- The current data presented by the US Fed shows inflation is coming down in the US, and therefore the narrative has been one of a possible ‘soft landing’
- However, this is based on ”Super Core Inflation” which excludes energy and housing costs…Standard CPI data shows an uptick in inflation since June 2023, driven by rising energy costs (ref 3).
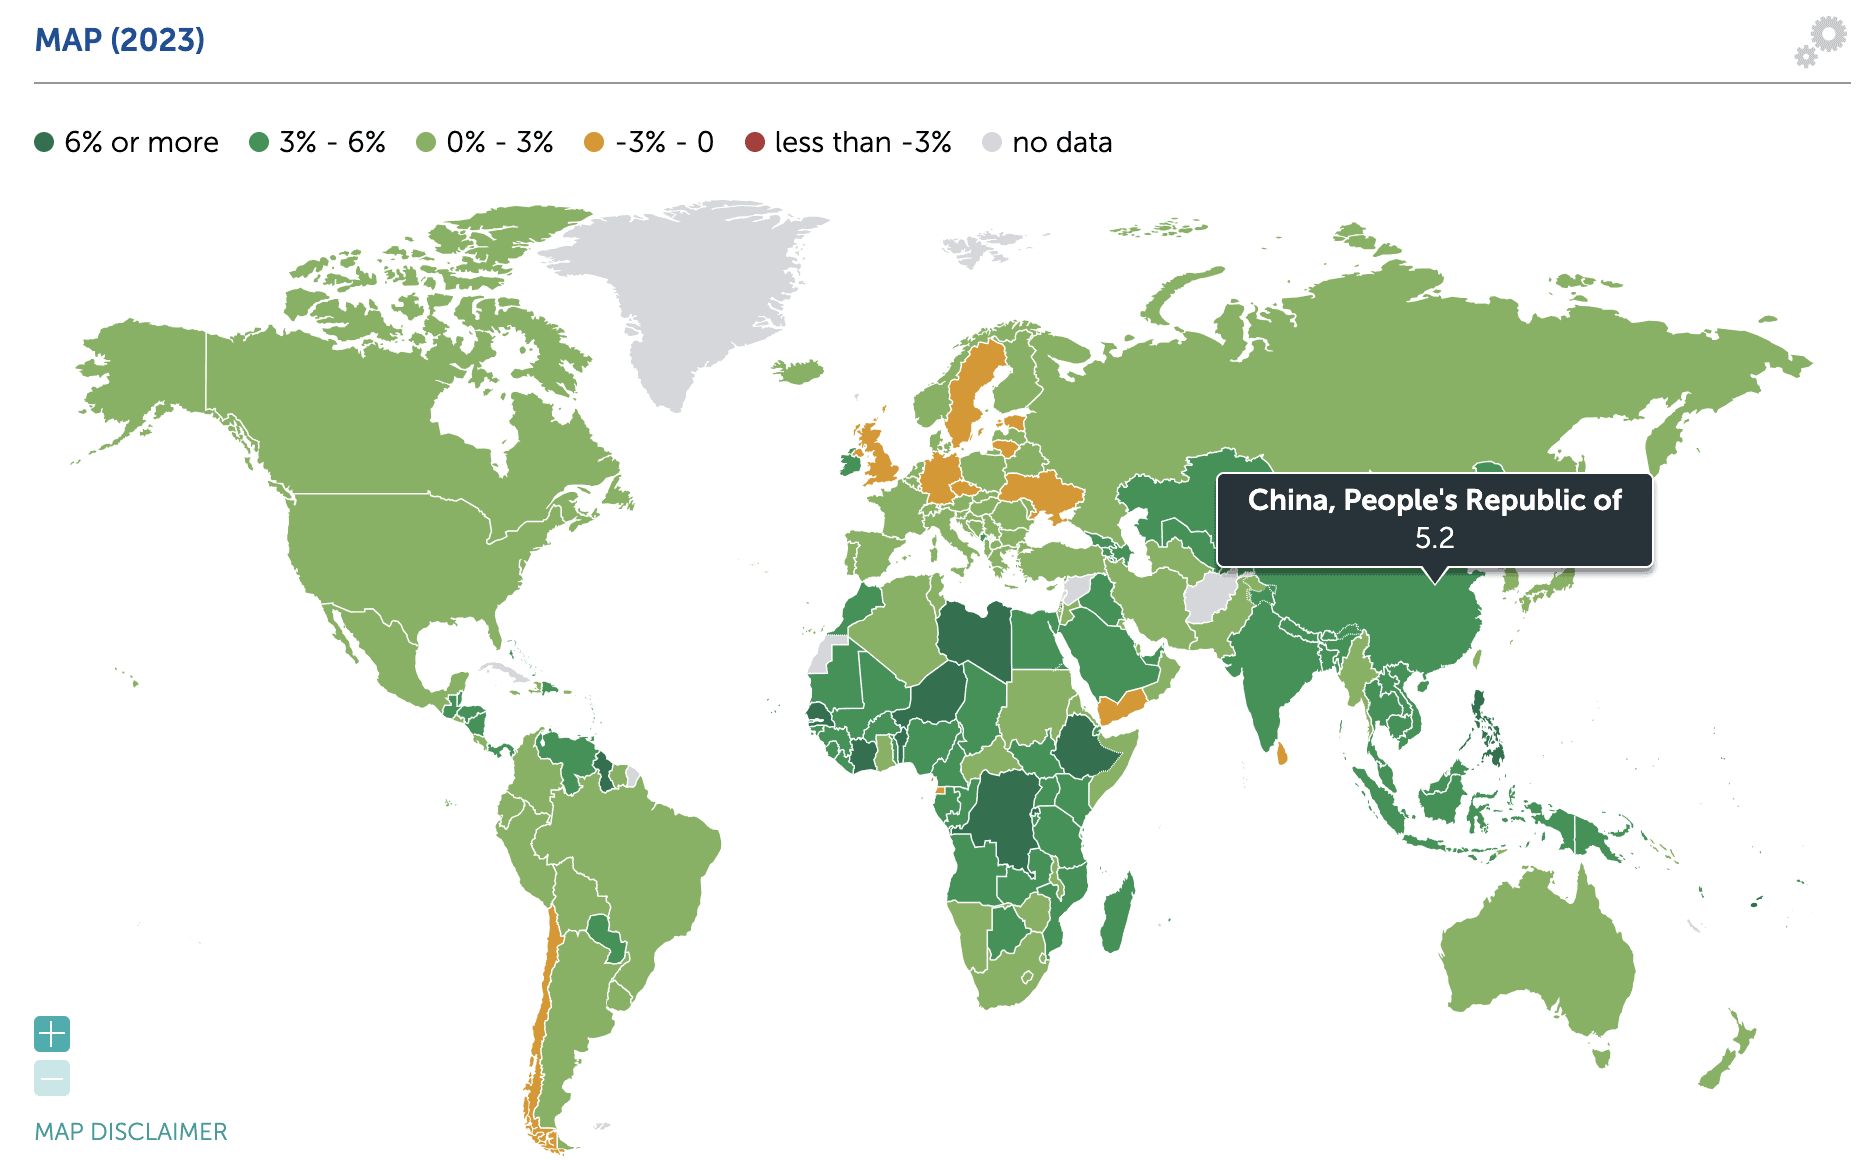
- China’s current “real GDP” data
- Current growth statistics state the economy is growing 5.2% year on year (ref 4)… implying a healthy economy narrative
- While on the ground the property crisis is clear, consumer confidence is low and there is huge uncertainty and pessimism in business circles. It would not be too much of stretch to imagine the REAL real GDP growth trajectory is much lower.
As shown above, incorrect narratives, propelled by unreliable data, can lead to misguided policies and misinformed public opinion and potentially bad investment decisions. A proactive approach involves fostering media literacy and critical thinking skills while also encouraging open dialogues and debates to dissect and challenge prevailing narratives.
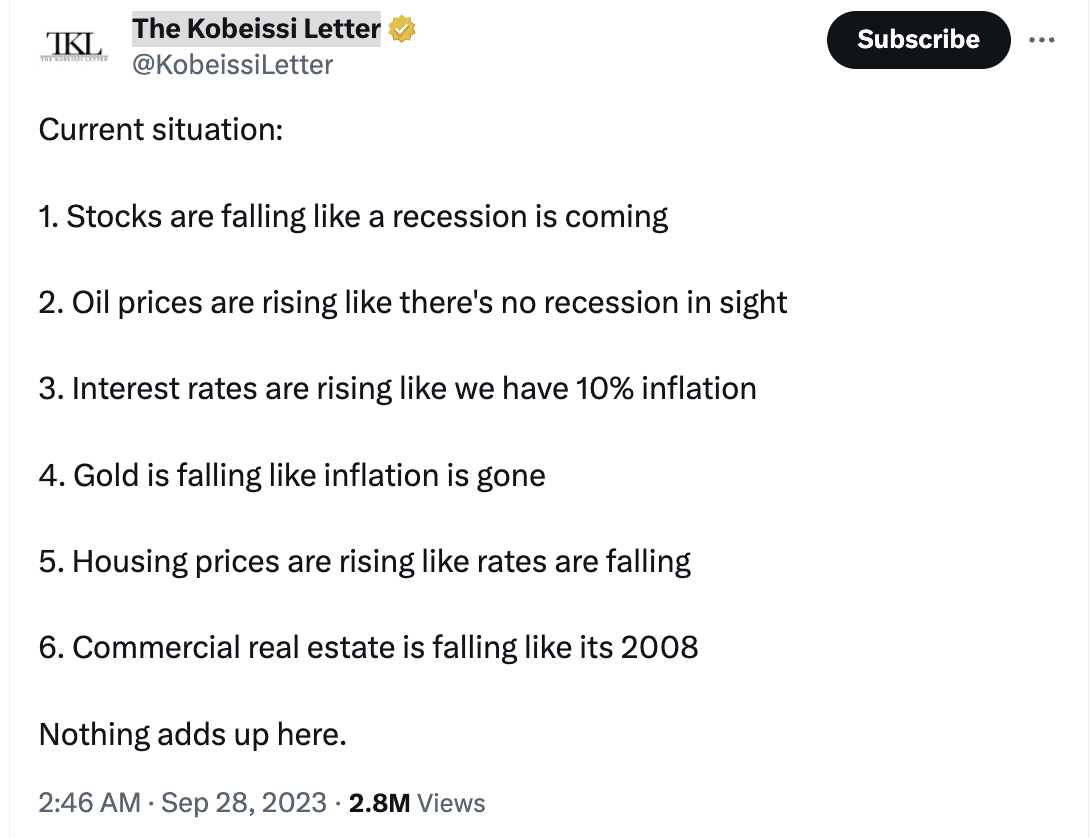
An inability to trust the narratives and data presented, is I believe a factor in the confused state of the financial markets. This tweet captures this confused state well:
Taking contrarian bets & the value of alternative data
Narrative chaos creates huge challenges, but also presents immense opportunity, for those who can find alternative data that can be relied on. So how can you do this? What alternative data can you look to?
These are some of the places I’m looking to for alternatives to decipher what is actually happening:
- Leading Listed Company Results: Financial Data (e.g. revenue growth by region) core KPIs (e.g. for Apple, iPhone sales) comments from management teams around outlook and key results drivers. The Transcript does a great job of highlighting some of this: (The Transcript)
- Scraped data from platform businesses: companies such as Yipitdata aggregate this information across platforms to decipher trends: (Yipitdata)
- Being observant: e.g. observed changes in visitor numbers in city centers, airports, shops, hotels, etc; number of marine cargo ships traversing key trade routes; certain products running out of stock while other are heavily discounted etc (Ref 6)
- Payments company data: Mastercard has some really good insights: (Mastercard SpendingPulse)
- Actually talking to people: discussions with taxi drivers on customer/travel trends, with business contacts and colleagues on demand for products and services in different markets, etc.
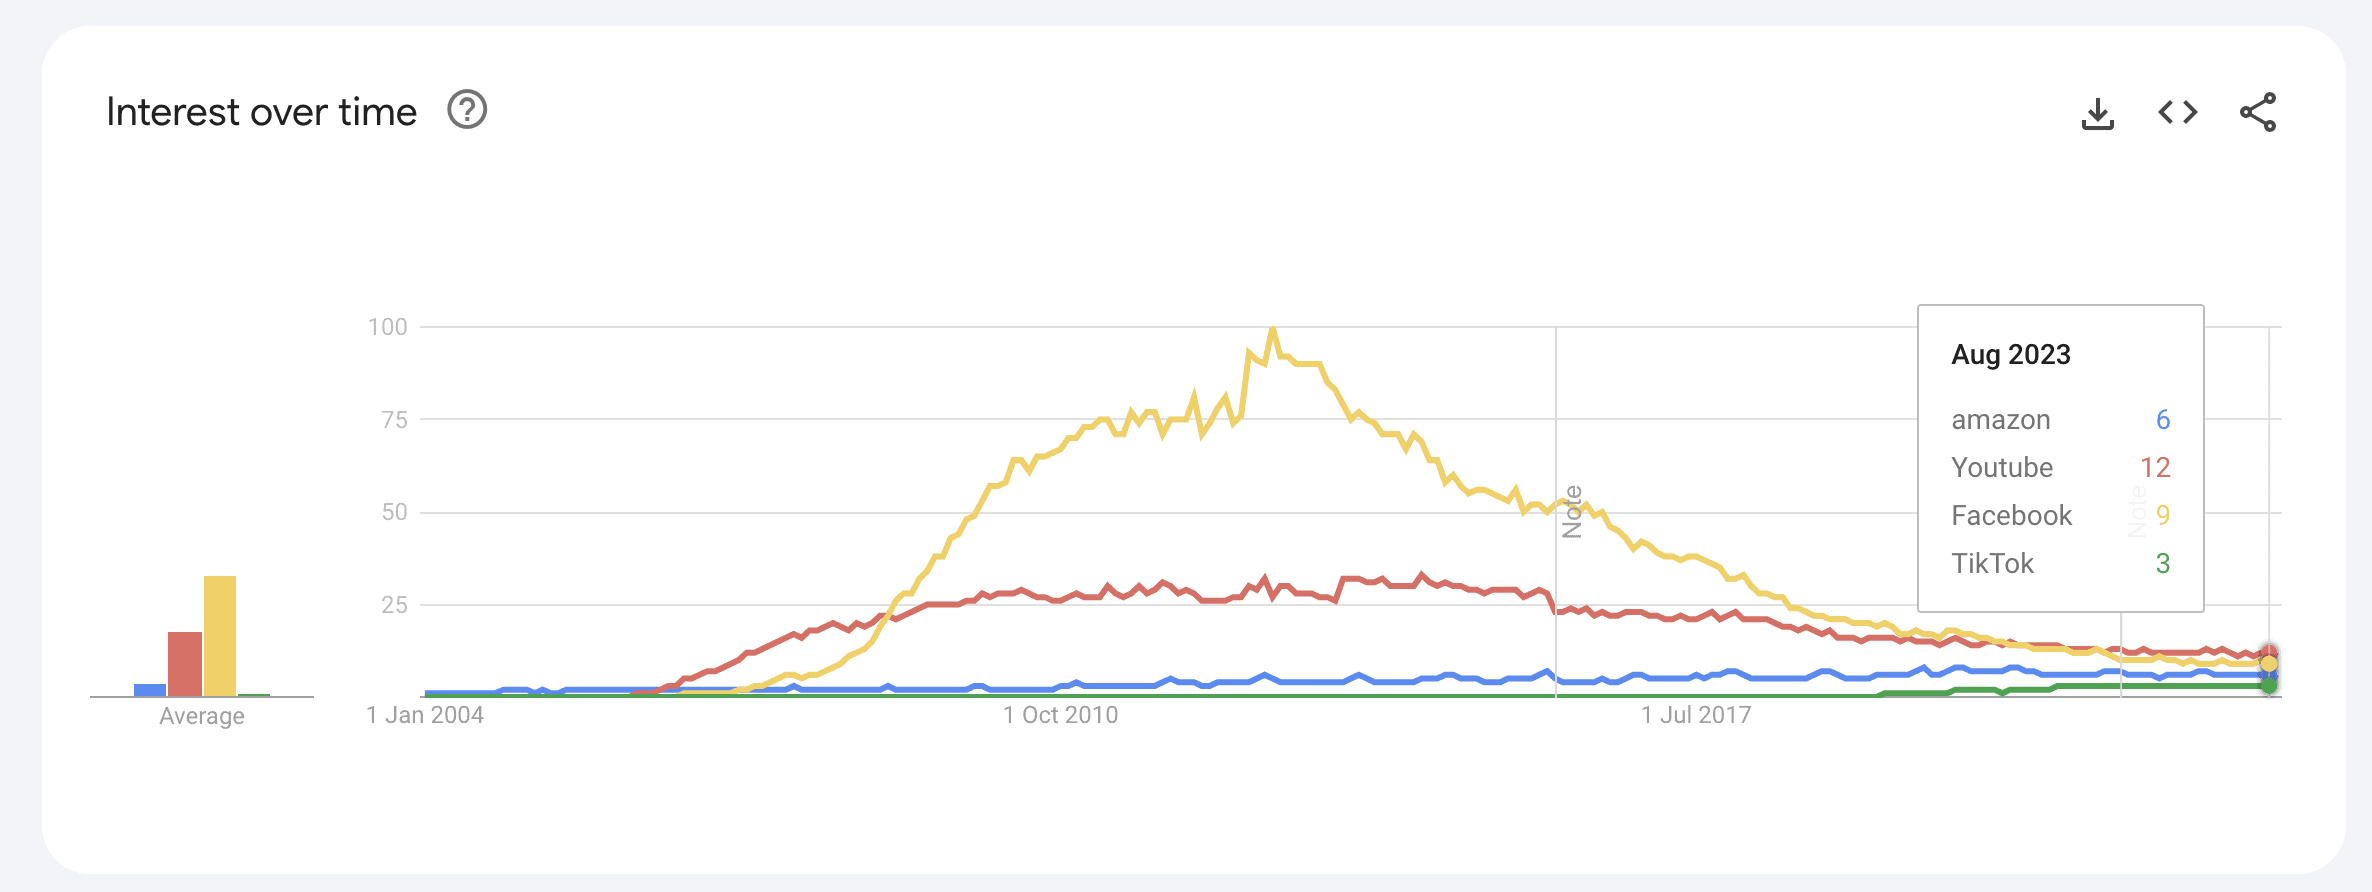
- Web Search Data: e.g. Google Trends Data – from which you can deduce what people are interested in, consumer sentiment, etc (ref 5)
- The geographical locations companies are moving senior personnel to: where the large PE and Hedge Funds are moving their people is particularly telling about geographical bets
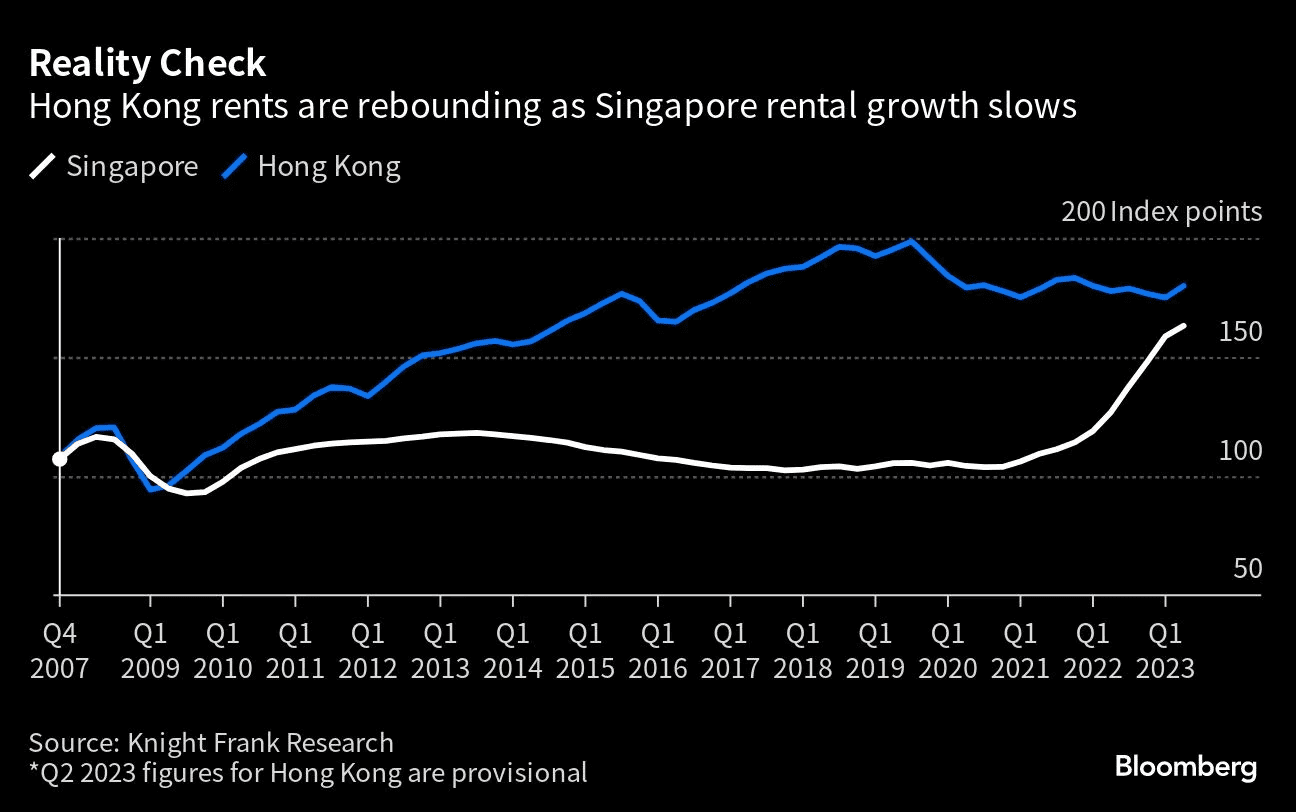
- House price data: For example, analysing Hong Kong and Singapore rental trends indicates we hit the peak Hong Kong to Singapore expat migration in 1Q23, and we may be seeing a reversal.
I feel harnessing unconventional data sources and employing advanced analytical tools, such as AI-driven data analysis, will be increasingly used to unearth hidden patterns and insights, providing a more nuanced understanding of the underlying realities. I expect quantum computing in data analysis will also exponentially enhance our ability to process and interpret alternative data.
Here are some insights I thought were interesting from simply reading results transcripts from recent earnings calls:
| INSIGHT | C-SUITE QUOTE @ LISTCO |
|---|---|
| Oil Prices are (probably) going to keep rising | Total CEO: “I’m sure that you all picked up on the latest report from the IEA, saying that demand will grow through the decade. guess what? We agree when the IEA may say that. And we show here their own forecast rising all demand to 106 million barrels per day in 2028” |
| Consumer sentiment is falling; customers are trading-down | CostCo CFO: “Our average transaction or ticket was down 3.9% worldwide and down 4.5% in the U.S., impacted in large part from weakness in bigger ticket nonfoods discretionary items as well as the gas price deflation.” Wallmart CEO “We do see some behavioral change for some customers that are particularly pressured from a budget point of view. We do see pack size changes, moves to private brands, all those kinds of things that you historically have heard us talk about. But not everybody is in the same situation.” JP Morgan CEO: “ll tell you about the consumer, but there’s a big but…it’s pretty good…to say the consumer is strong today, meaning you’re going to have a booming environment for years, is a huge mistake” |
| Covid-driven changes in working arrangements are here to stay | AirBNB CEO: “In fact, in the past six quarters, long stays, long weekend stays have been the fastest growing trip type on Airbnb. I think this is just evidence of the incremental flexibility people have post-pandemic.” |
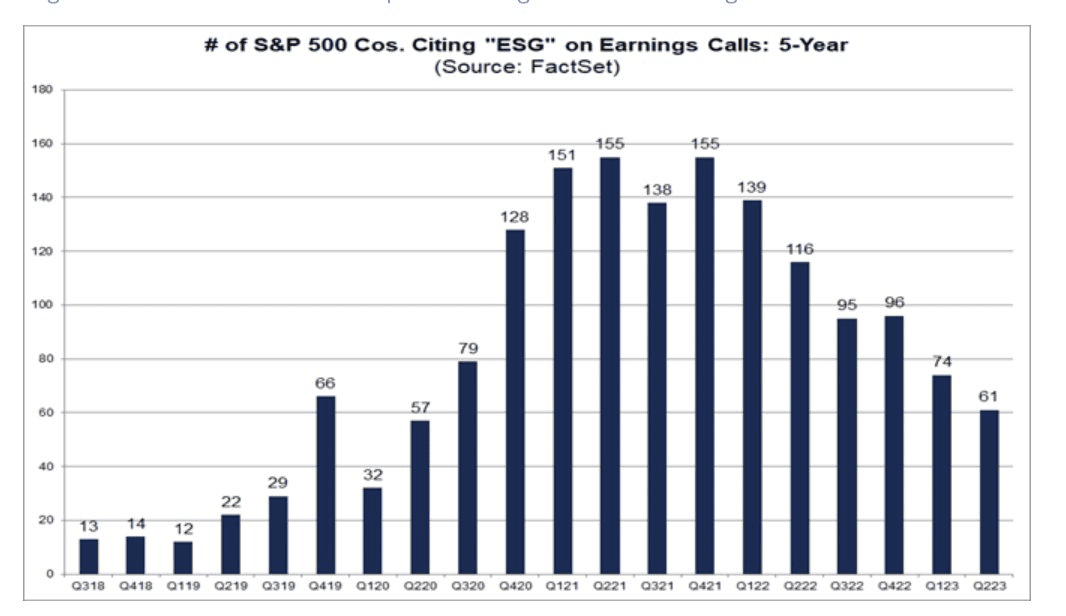
| Decline of virtue-signalling / cooling interest in ESG | References to ESG across all earnings calls just hit a 5 year low (ref 7). |
| Inflation is stickier than suggested by the US Fed | 3M CFO: “You saw the CPI data that came out today too. Inflation is still sticky. For us, where we are seeing it being sticky, labor cost is still quite sticky when we see it from suppliers.” |
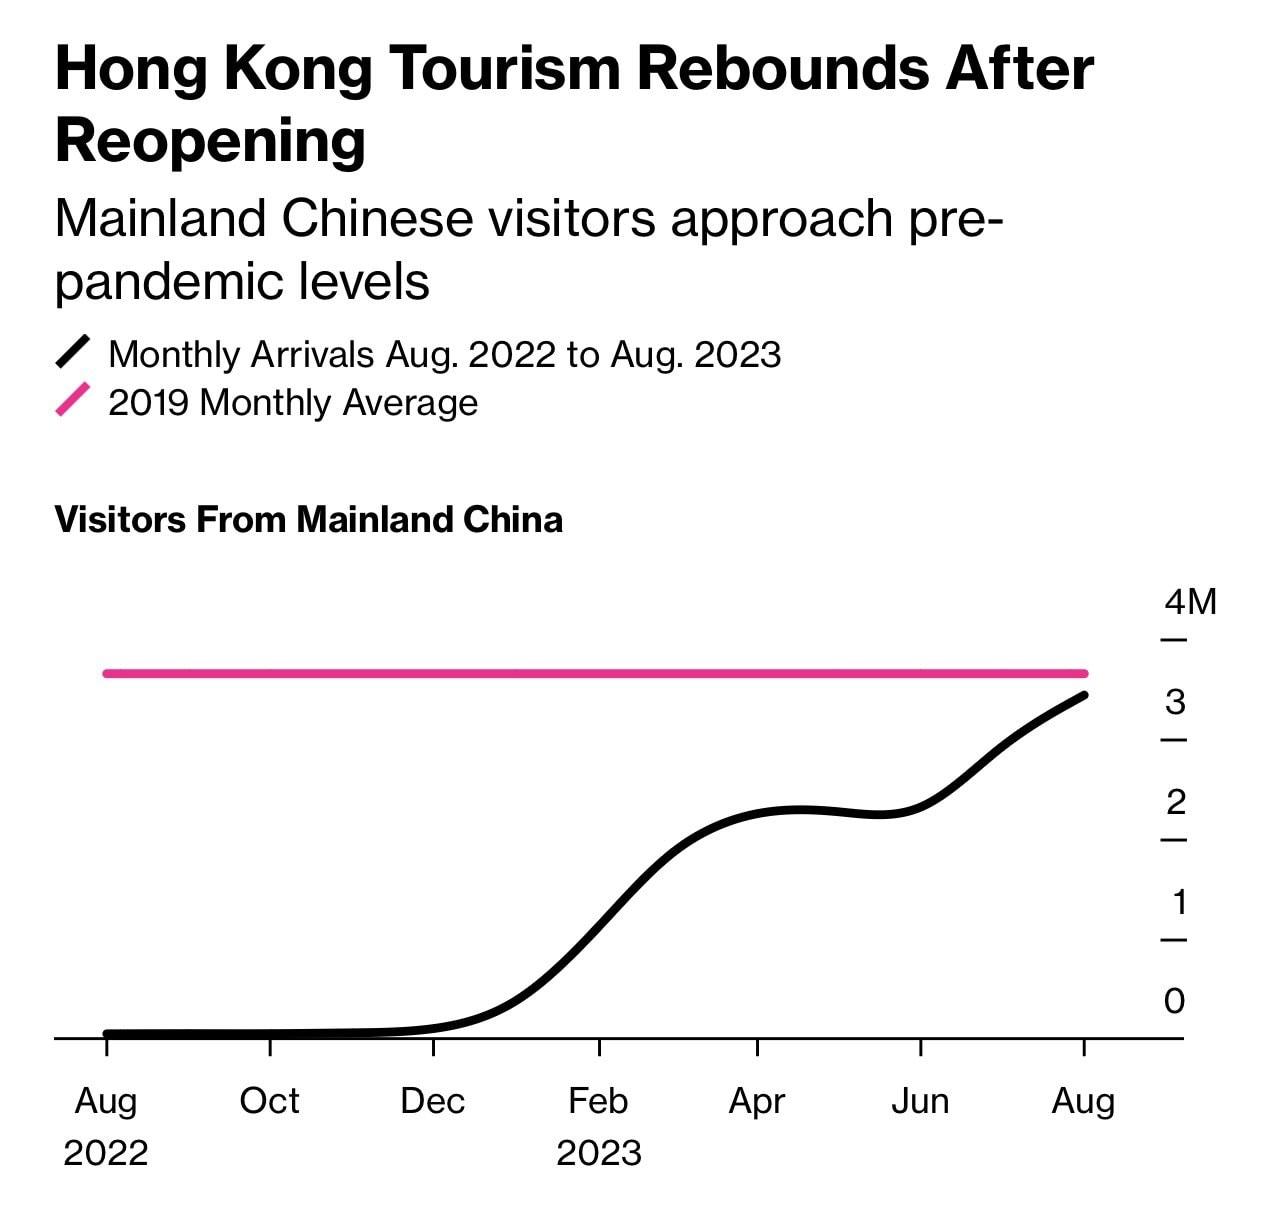
| Post-lockdown demand for travel and experience remains strong globally, while spending on goods is declining | Mastercard CFO: “I mean, what we see from a consumer standpoint is that the consumer continues to be resilient. They continue to be spending on travel, they continue to be spending on experiences even as we look at the data through the end of August.” Trip CEO: “Throughout Q2, China’s travel industry has experienced a notable resurgence supported by unwavering travel demand….In China, travel demand has remained resilient, as a result of a shift in consumer spending away from goods and into service” |
| AI boom beneficiaries are data centers | Oracle CEO: “We have a great line of sight into the trajectory of the business, given the bookings momentum. We are extremely confident about our revenue acceleration for the year, even though in any quarter there may be small fluctuations. Because we have far more demand than we can supply, our biggest challenge is building data centers as quickly as possible.” AMD CEO: “So if you put all those factors together, we do see a very strong second half of the year for our data center business. It’s really on you know driven by some of the ramps in AI that we’re seeing and we feel good about it” Broadcom CFO: “Broadcom’s third quarter results were driven by demand for next generation networking technologies as hyperscale customers scale out and network their AI clusters within data centers” NVIDIA CEO: “We had an exceptional quarter. Record Q2 revenue of $13.51 billion was up 88% sequentially and up 101% year-on-year and above our outlook of $11 billion…Data Center compute revenue nearly tripled year-on-year, driven primarily by accelerating demand from cloud service providers and large consumer Internet companies for our HGX platform, the engine of generative AI and large language models” |
| The story of MNC exits from China is probably overblown | Nordson Corp CEO: “What we find with most of our global customers is there is some amount of rebalancing of supply chain going on but we don’t see anybody making significant moves out of China.” |
Conclusion
Many of the narratives we encounter seem to not align with the underlying realities, prompting thoughtful reflection and discernment.
“It’s a dumb game we woke westerners play where we say all the right shibboleths so everyone likes us.”
Sam Bankman Fried, November 2022
However, this collision of narratives and realities also unveils unprecedented opportunities for those willing to adopt contrarian positions and to see beyond the prevailing wisdom. It’s not merely about rejecting popular narratives, but about using alternative data to discern the underlying truths and leveraging it to navigate the economic landscape effectively. By embracing this approach, we can uncover unique insights and opportunities, allowing us to thrive in a world where many are struggling to merely make sense.
I am interested in understanding what others are using as sources of alternative data in order to discern the realities beneath the prevailing narratives. How are you leveraging these diverse information sources and technology to make informed decisions and to uncover opportunities?
Disclaimer:
Note: The following are personal views based on current trends and observations. They are not to be construed as financial advice or the view of KPMG.
References / Reality Checks
See below for data sources for some of the opinions set out above.