Mental Models
,  ,
,  , ,
, ,  ,
,  , ,
, , 
No models in this selection.
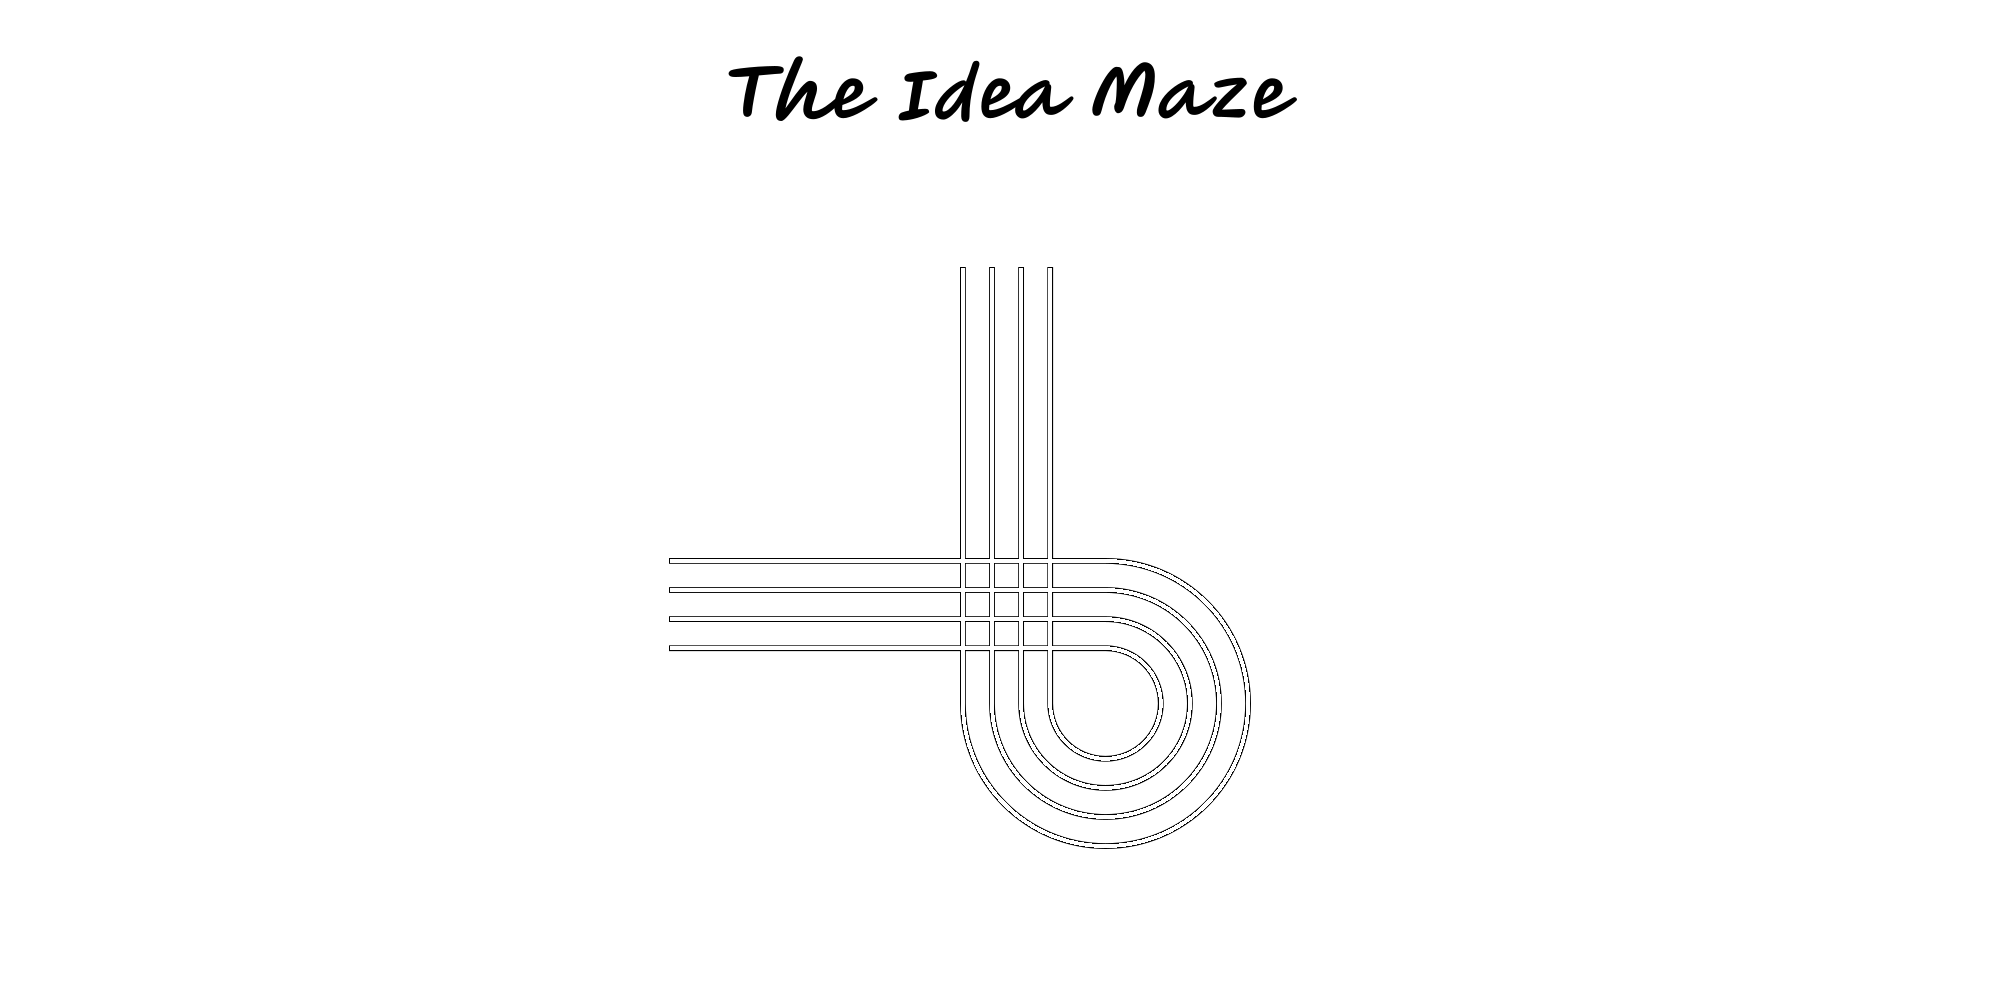
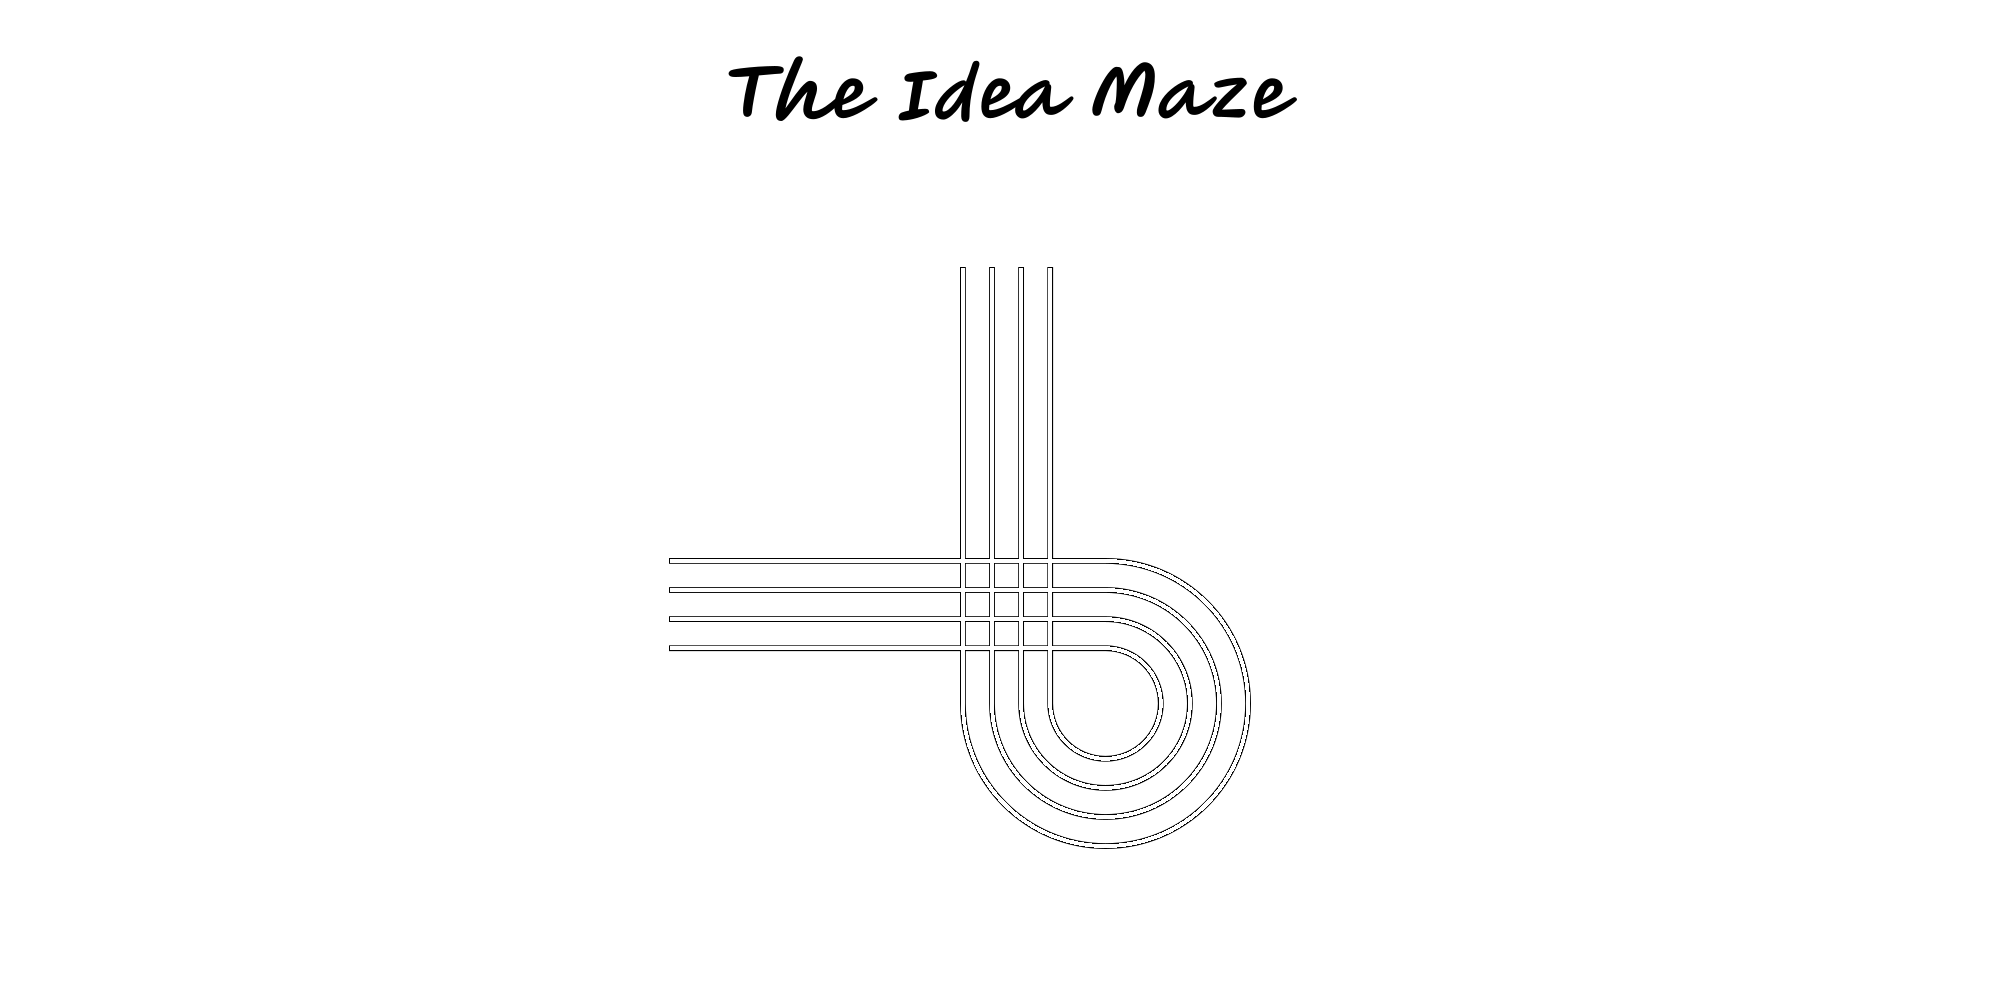
The Idea Maze
Before building, map the space: the key forks, dead ends and dependencies—so you can choose a promising path and run smarter tests.

The Map is not the Territory
All models are simplifications. Don’t confuse the representation (map, metric, plan, narrative) with the thing itself—and update the map when facts change.
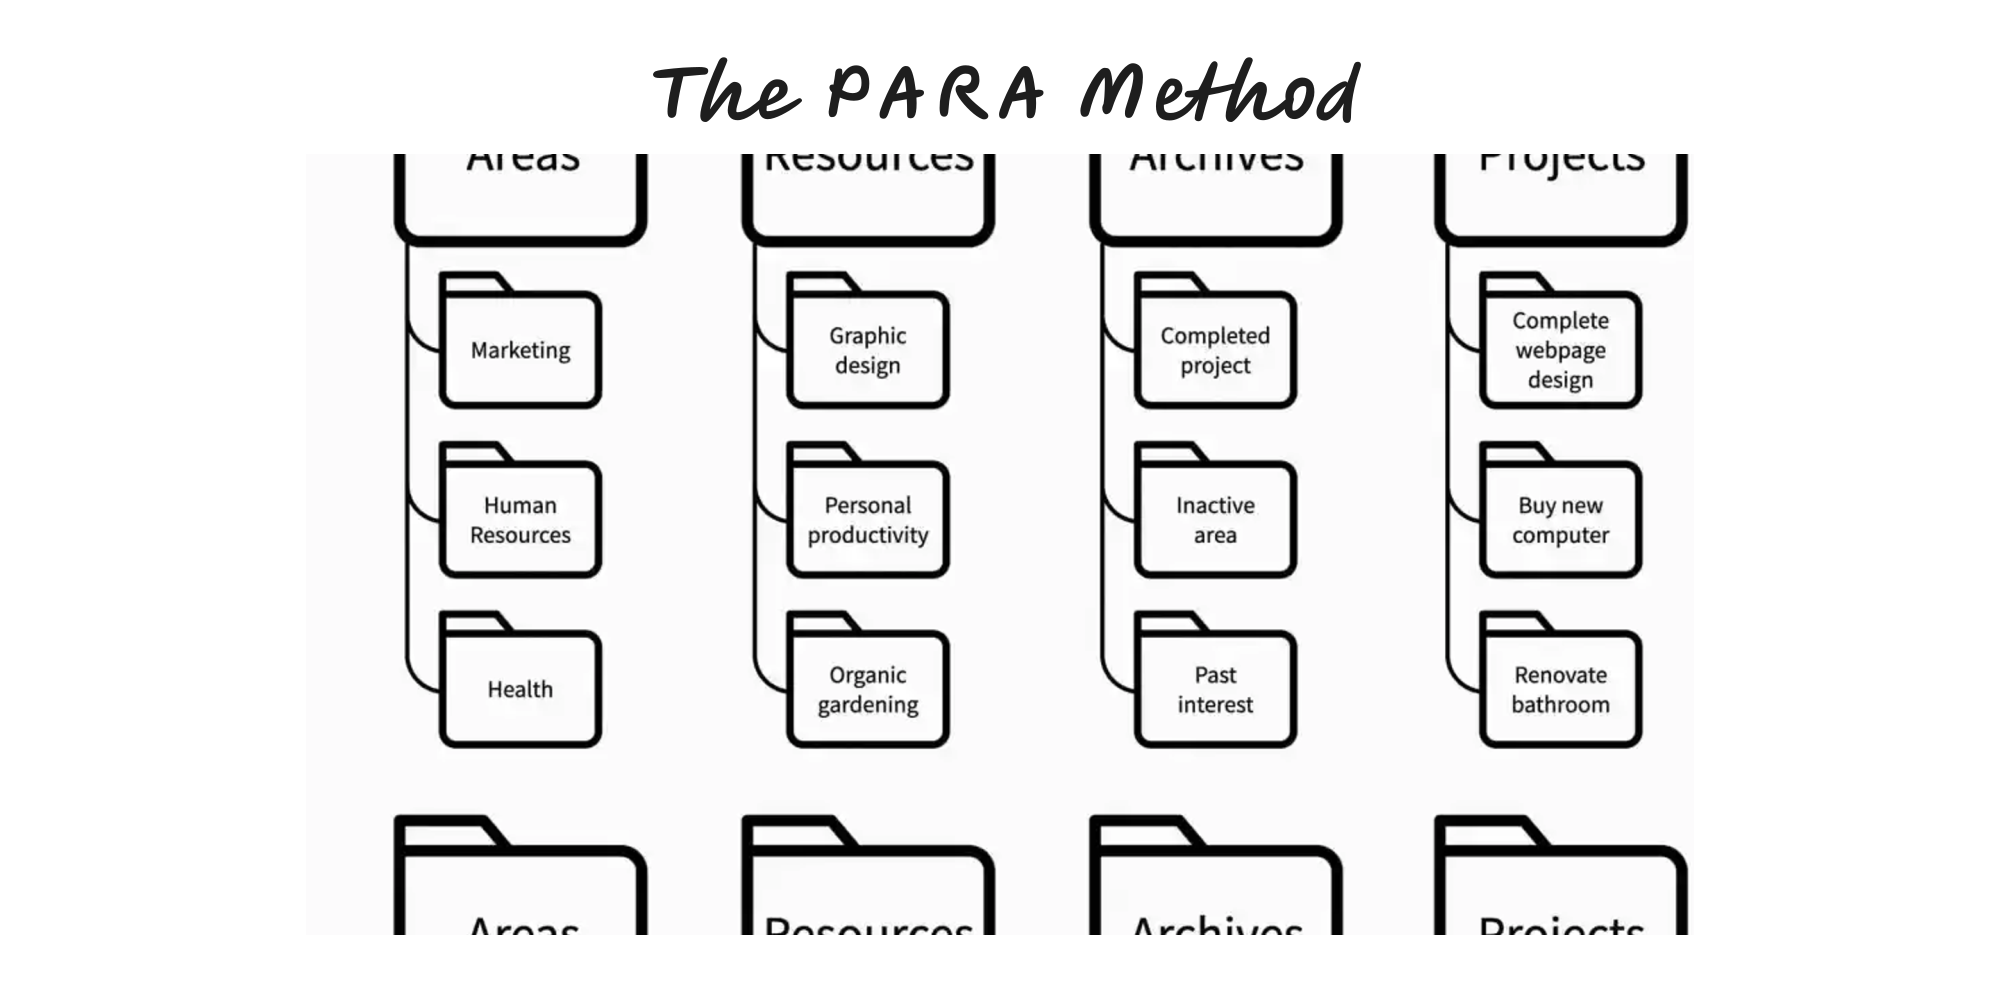
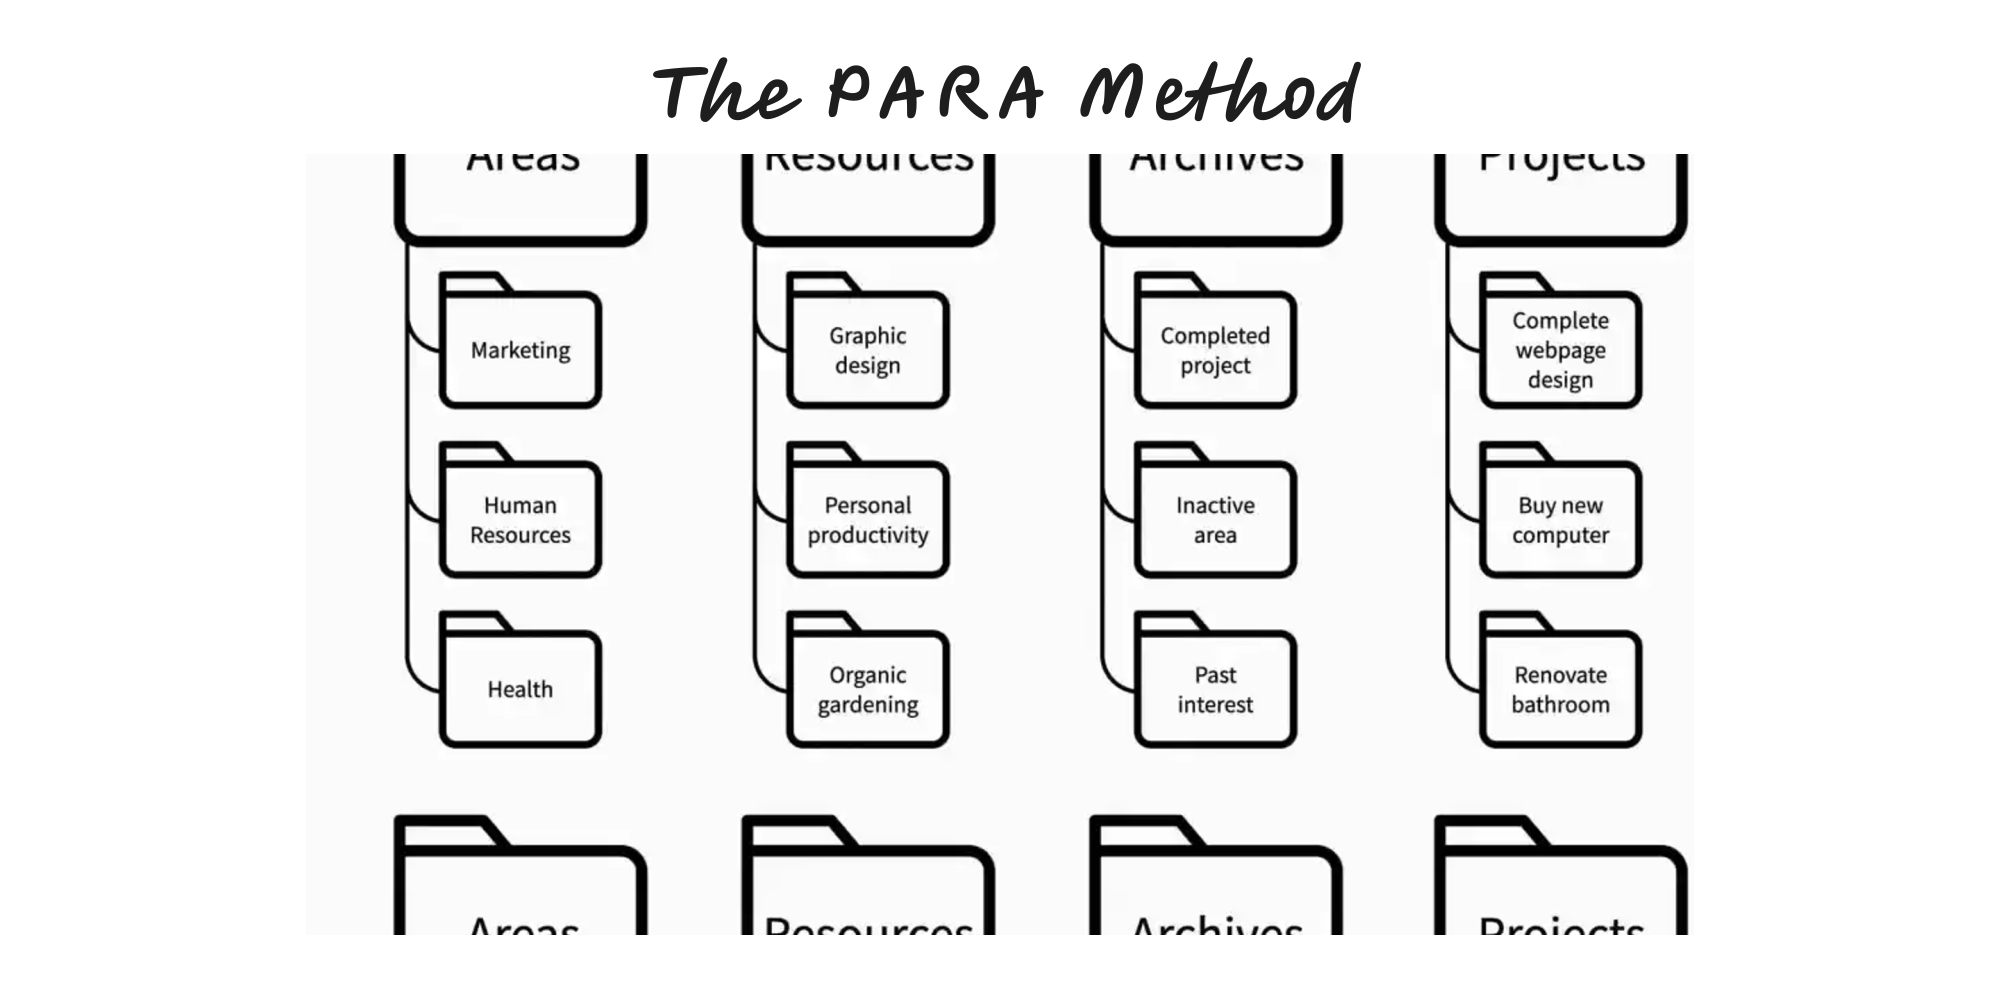
The PARA Method
Organise everything into four buckets—Projects, Areas, Resources, Archives—so what you need is one click from action.
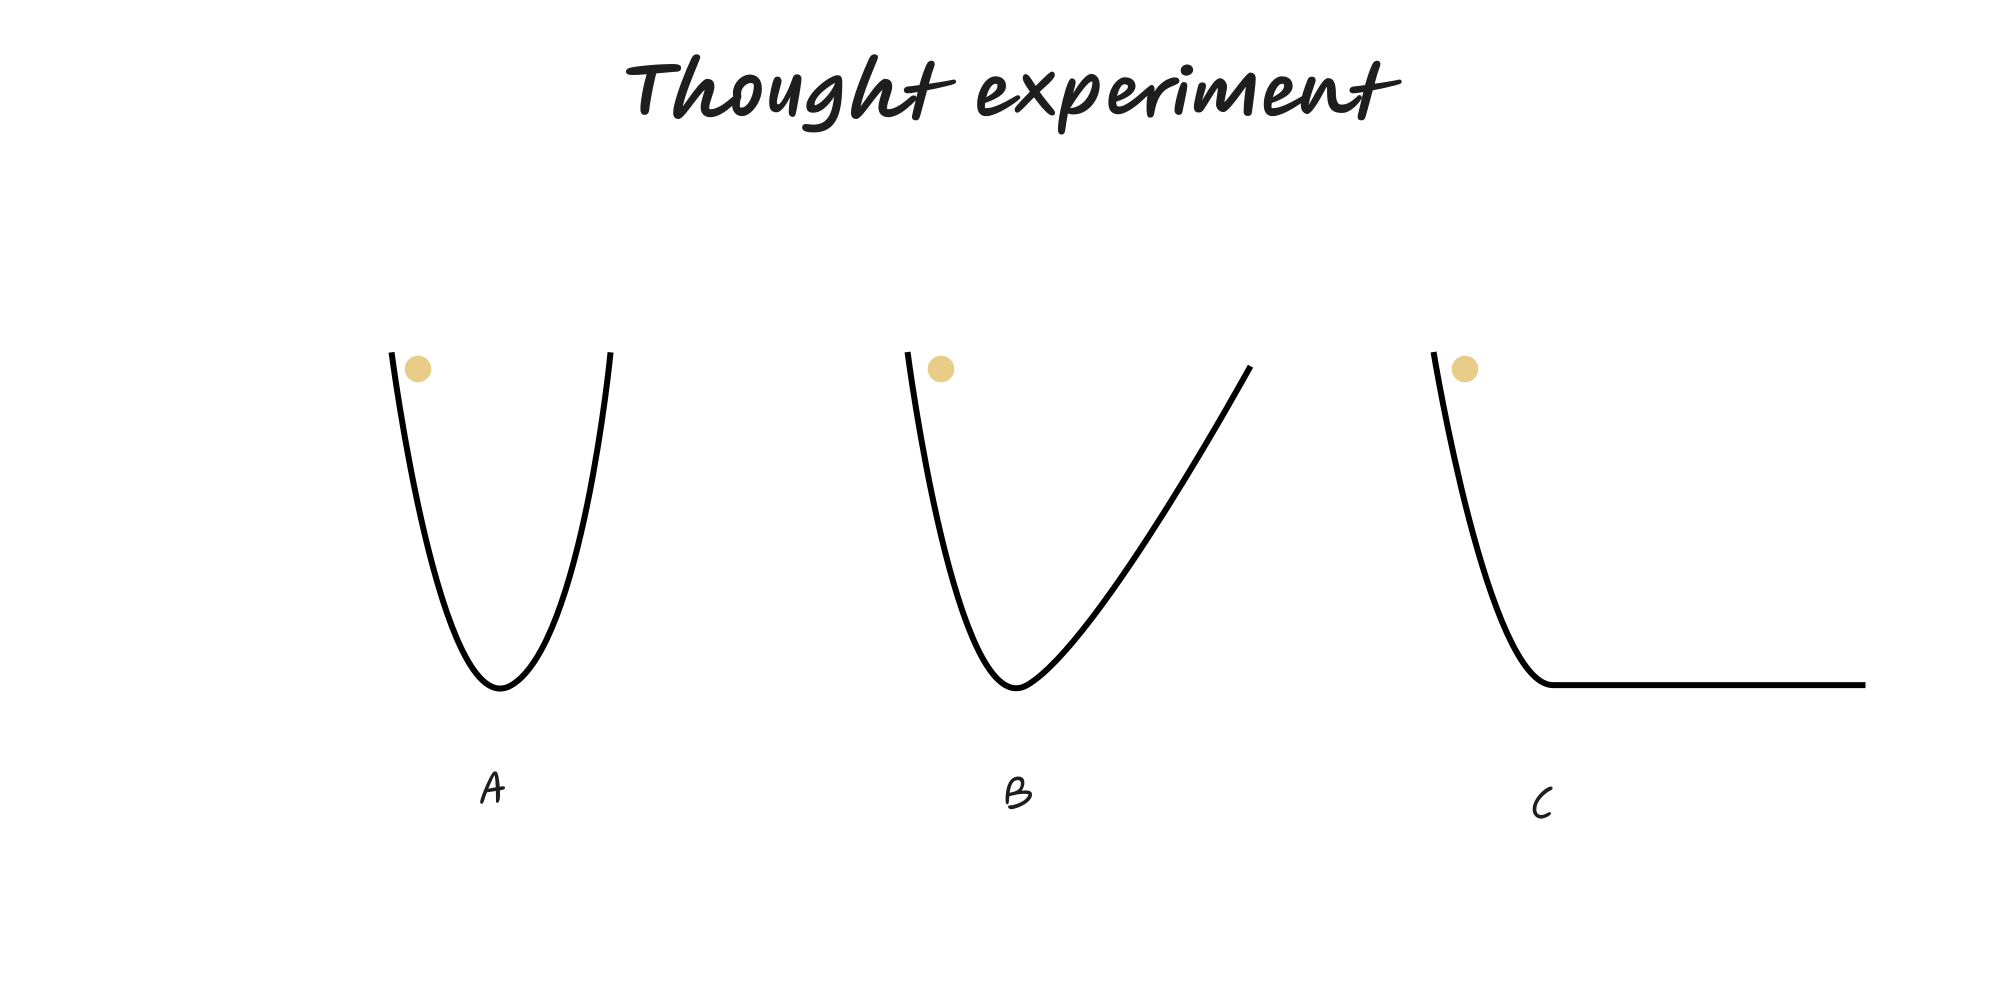
Thought Experiment
Use a carefully imagined scenario to test an idea’s logic, expose assumptions, and predict consequences—before you spend time or money.
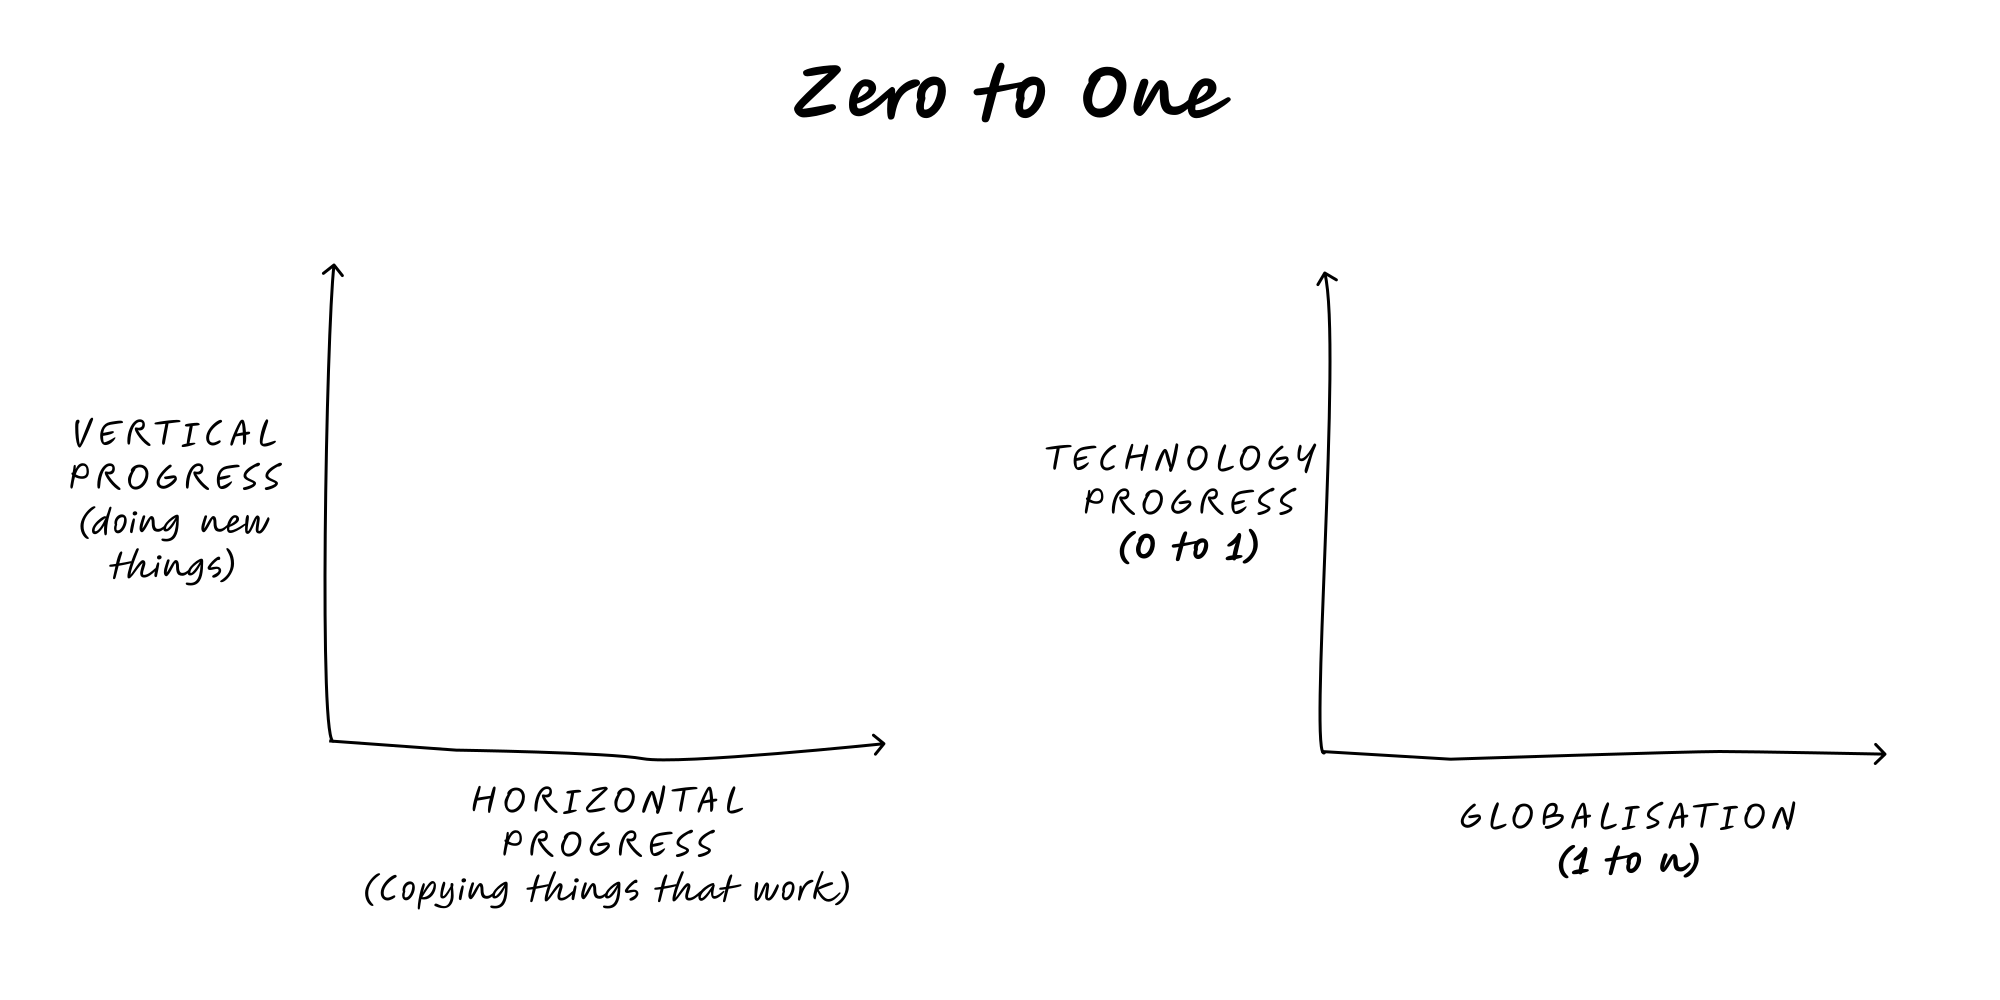
Zero to One
Aim for vertical progress—create something truly new (0 → 1), not just more of the same (1 → n). Win by building a monopoly on a focused niche and compounding from there.
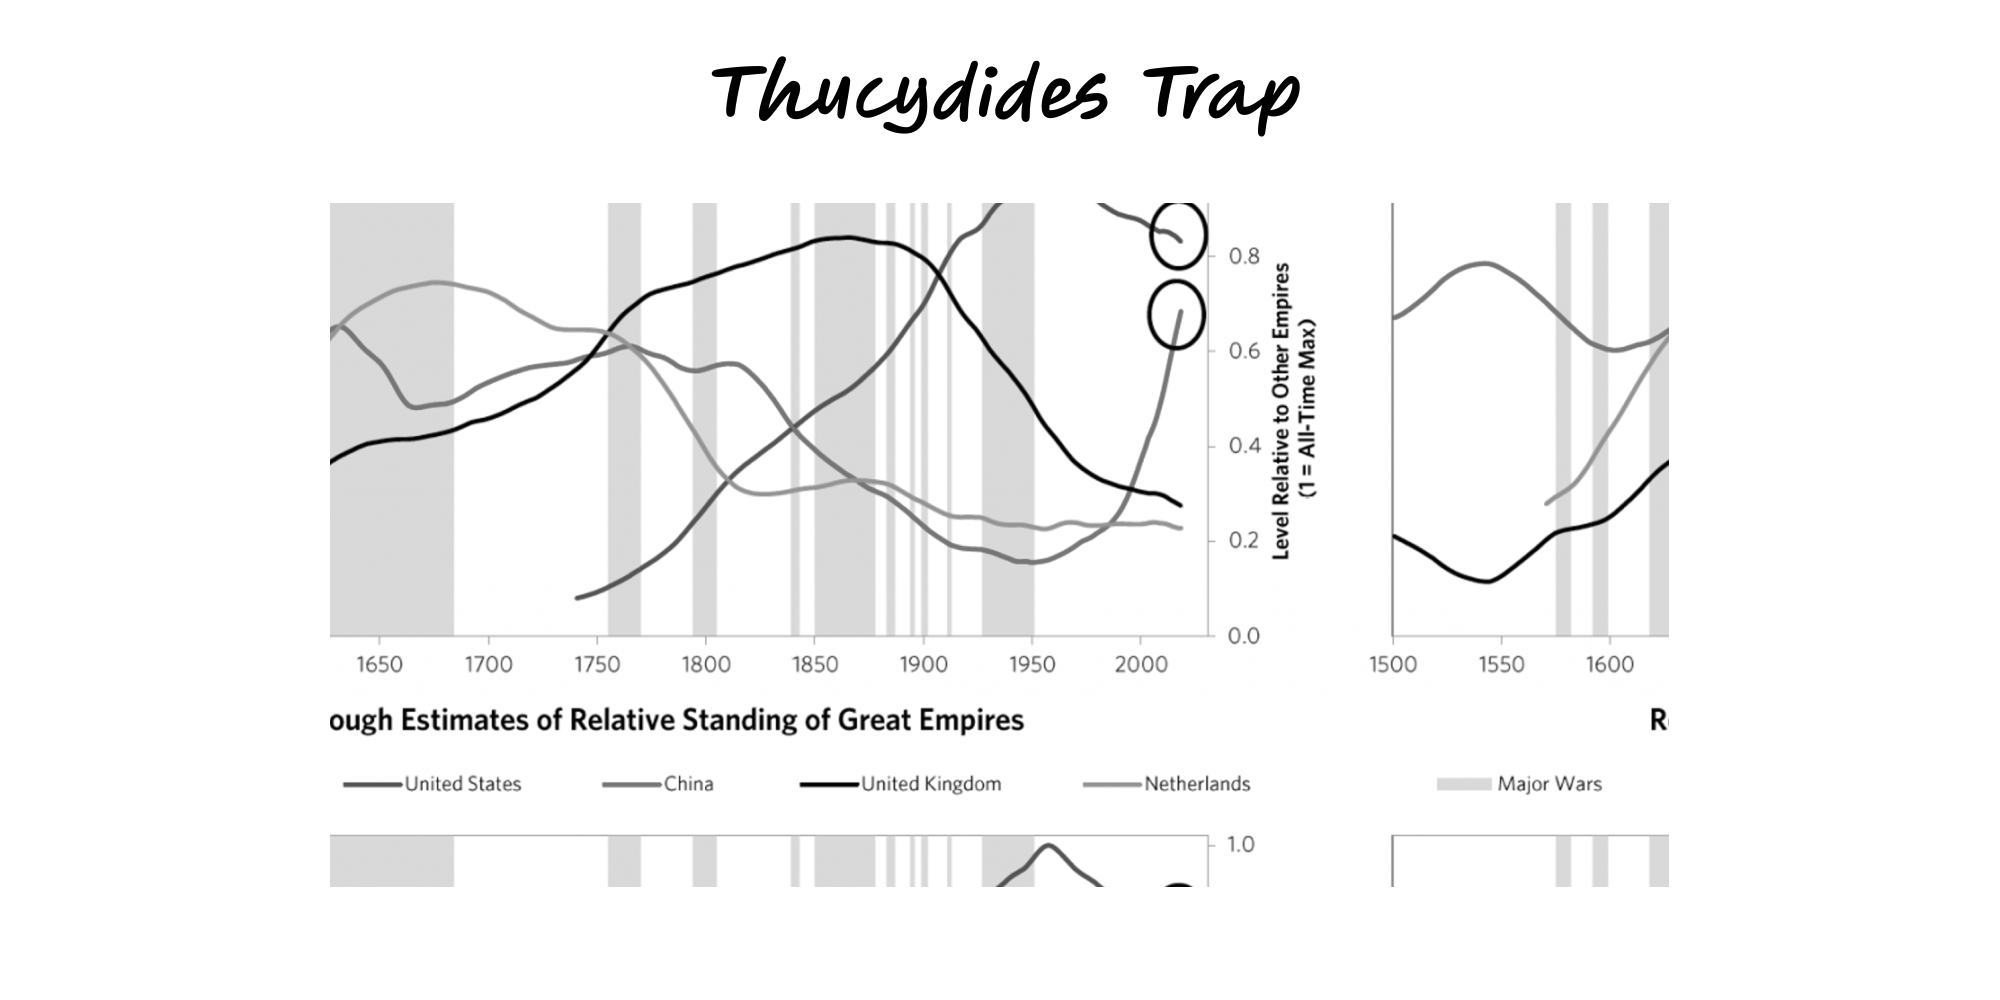
Thucydides Trap
When a rising power threatens to displace a ruling power, fear and miscalculation can tip competition into conflict unless incentives and guardrails are redesigned.
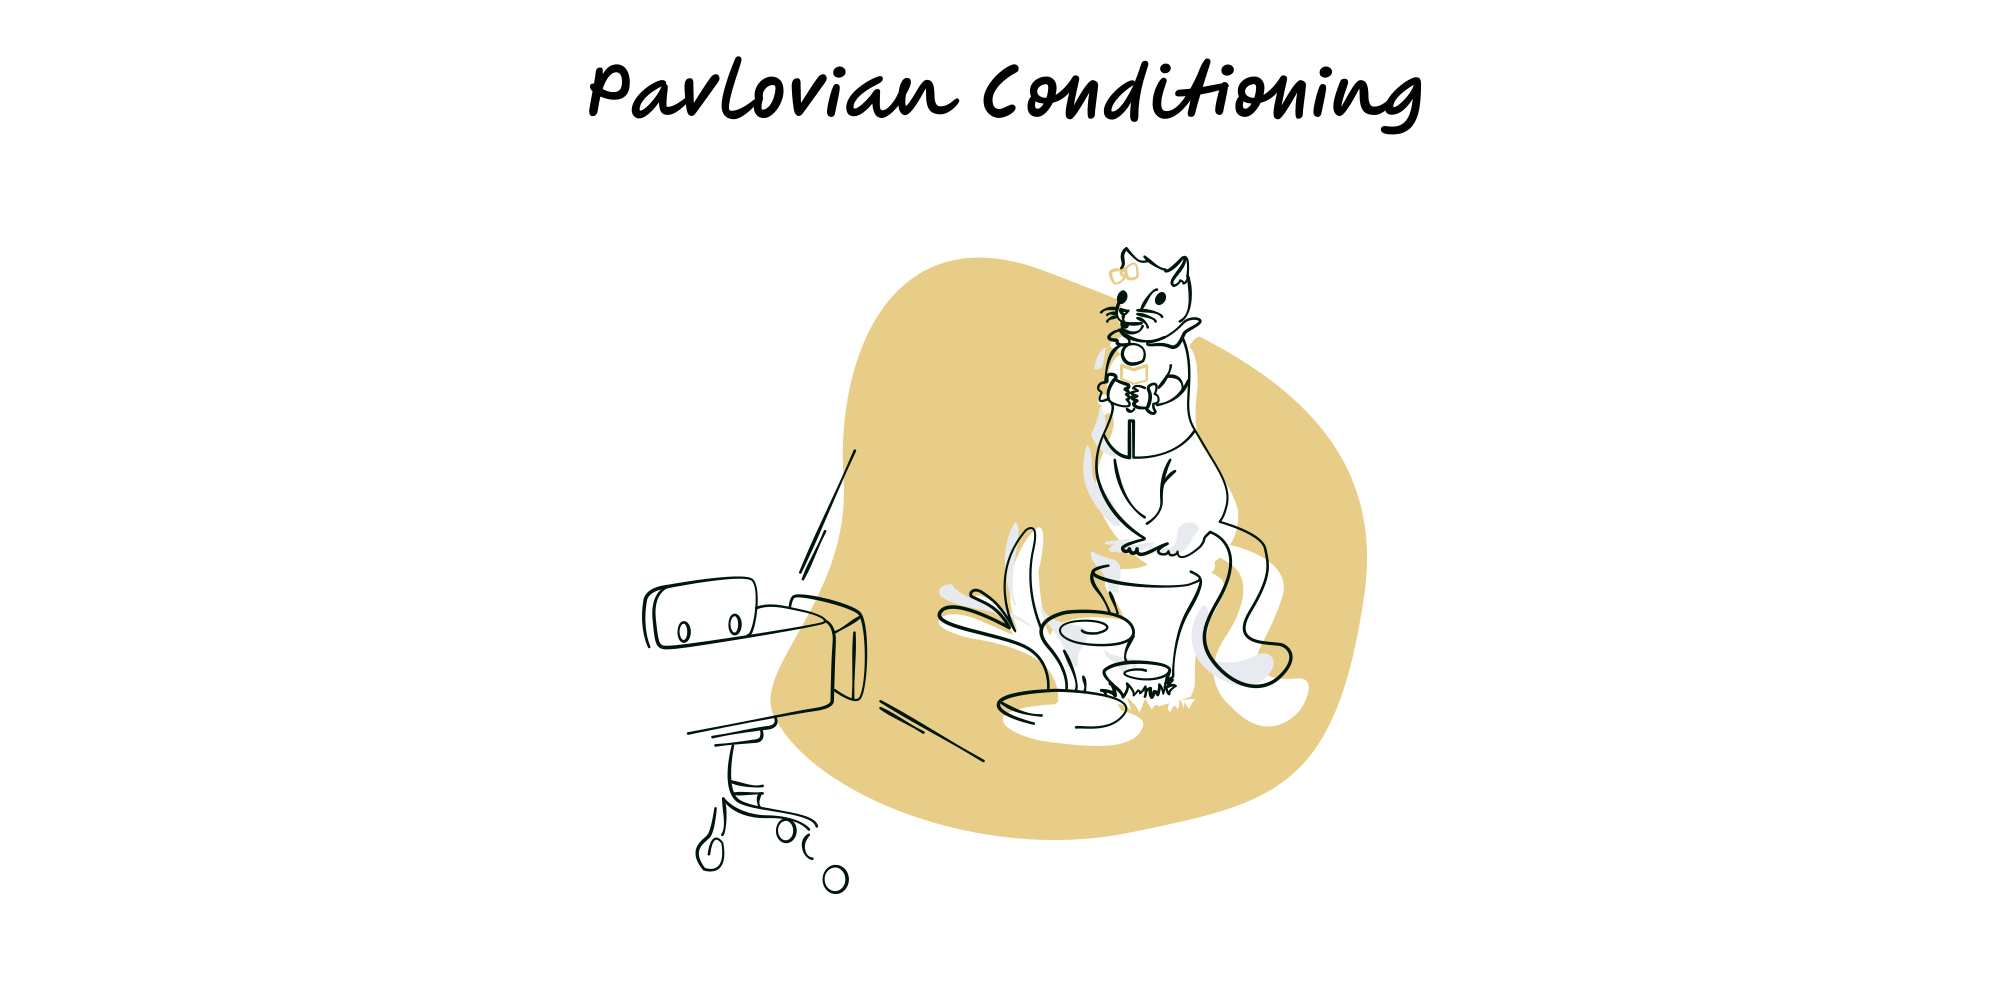
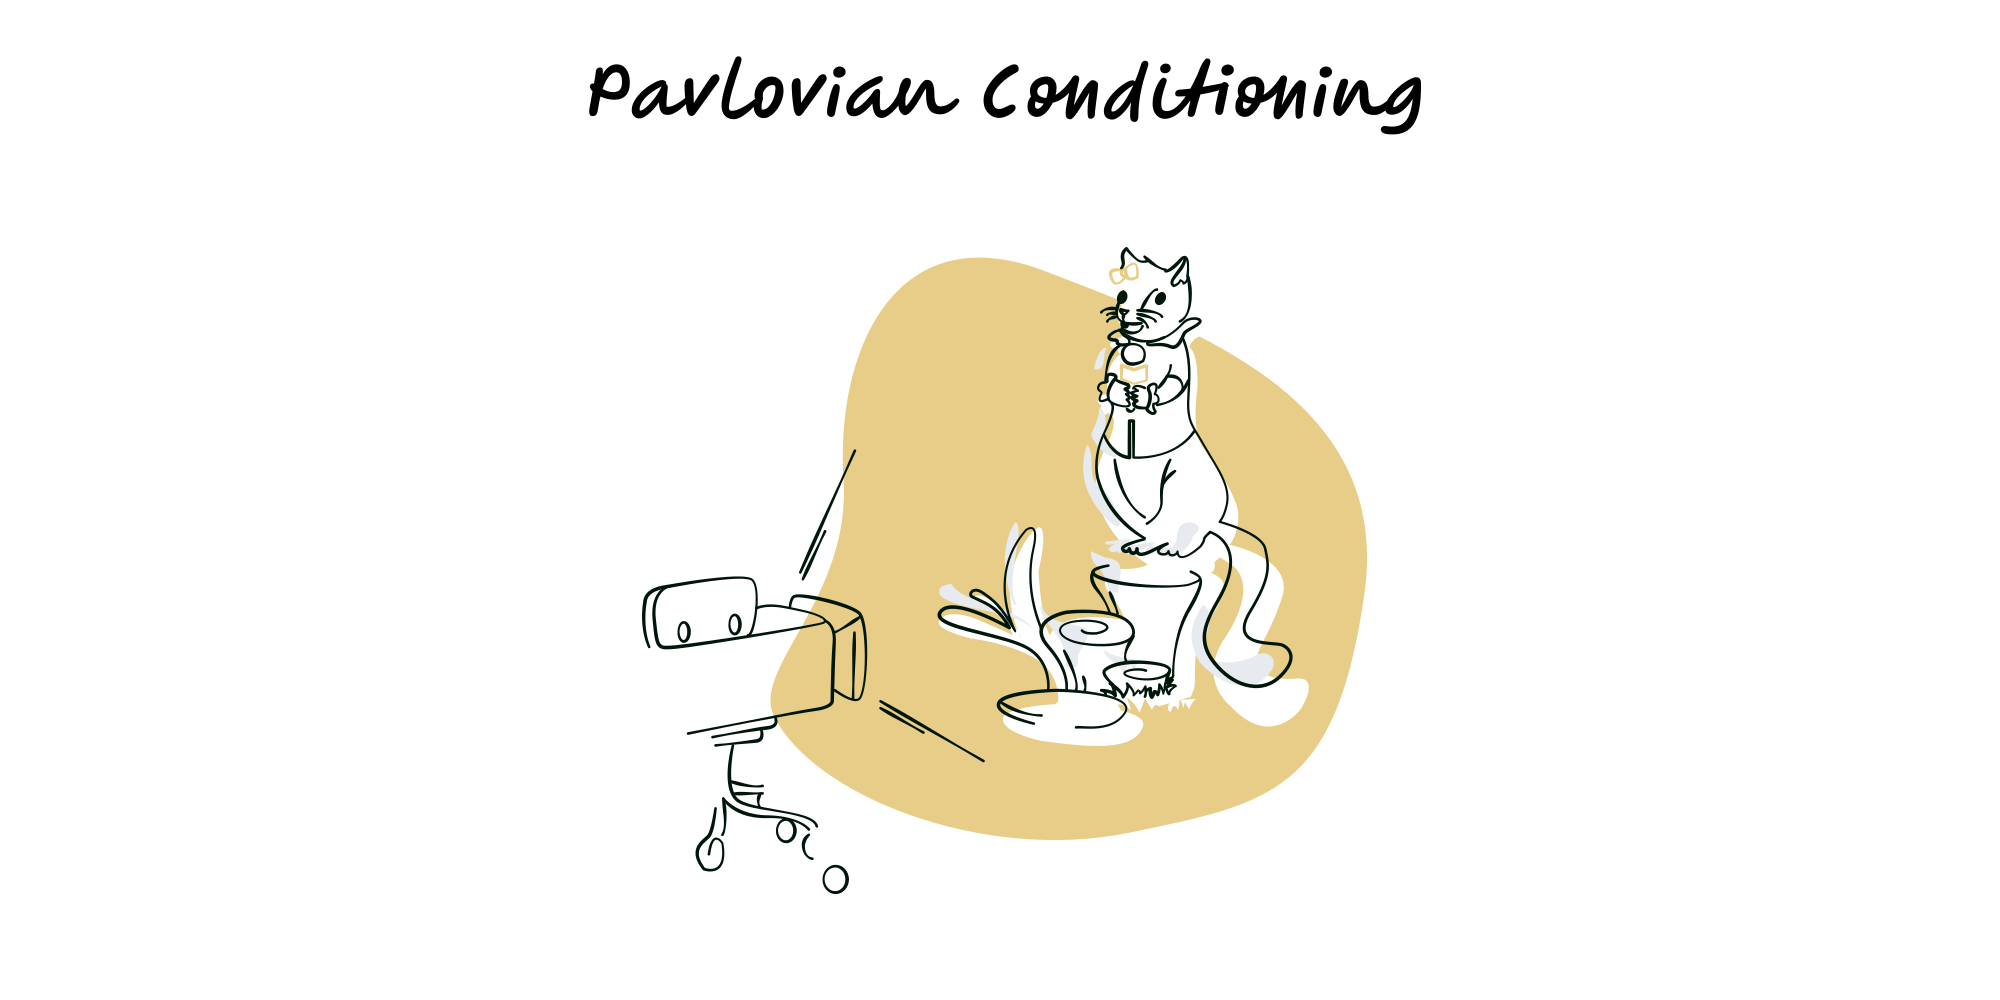
Pavlovian Conditioning
A neutral cue paired with a meaningful event can come to trigger the response on its own.
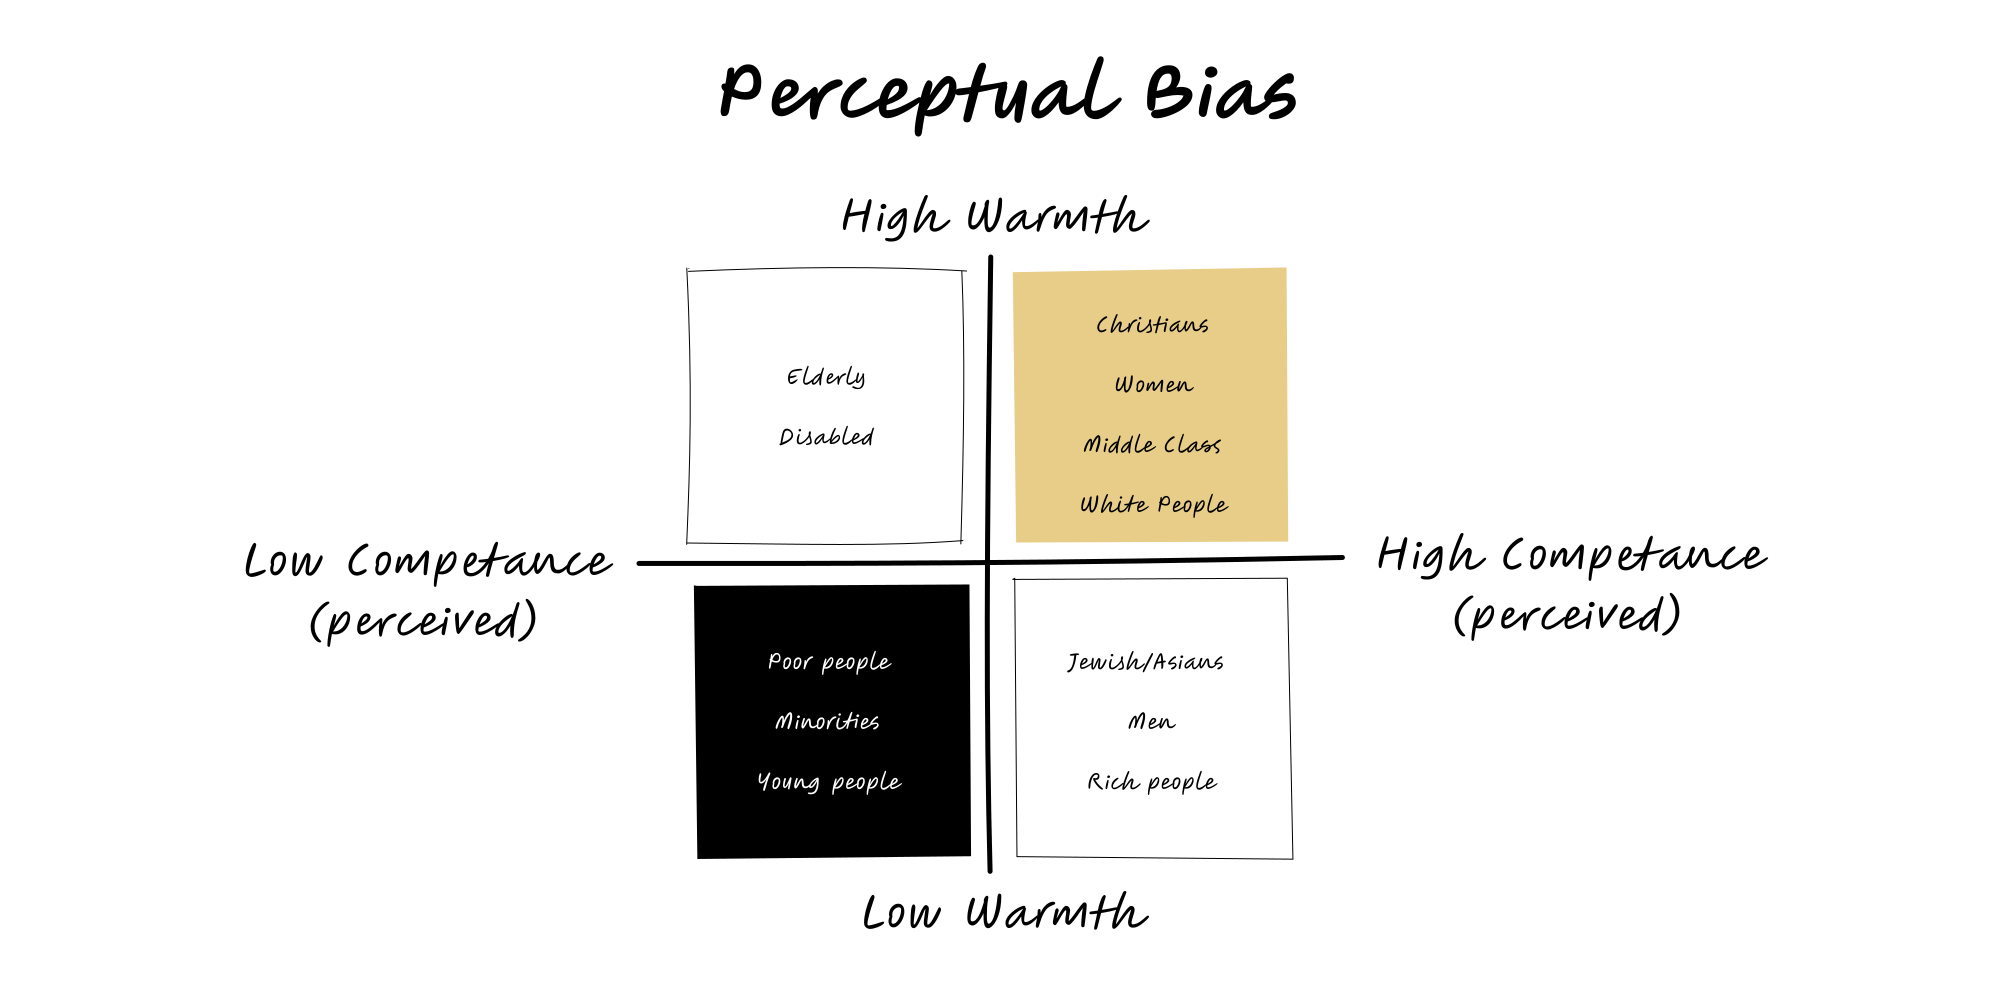
Perceptual Bias
When perception systematically deviates—illusions, context effects—so the same data looks different.
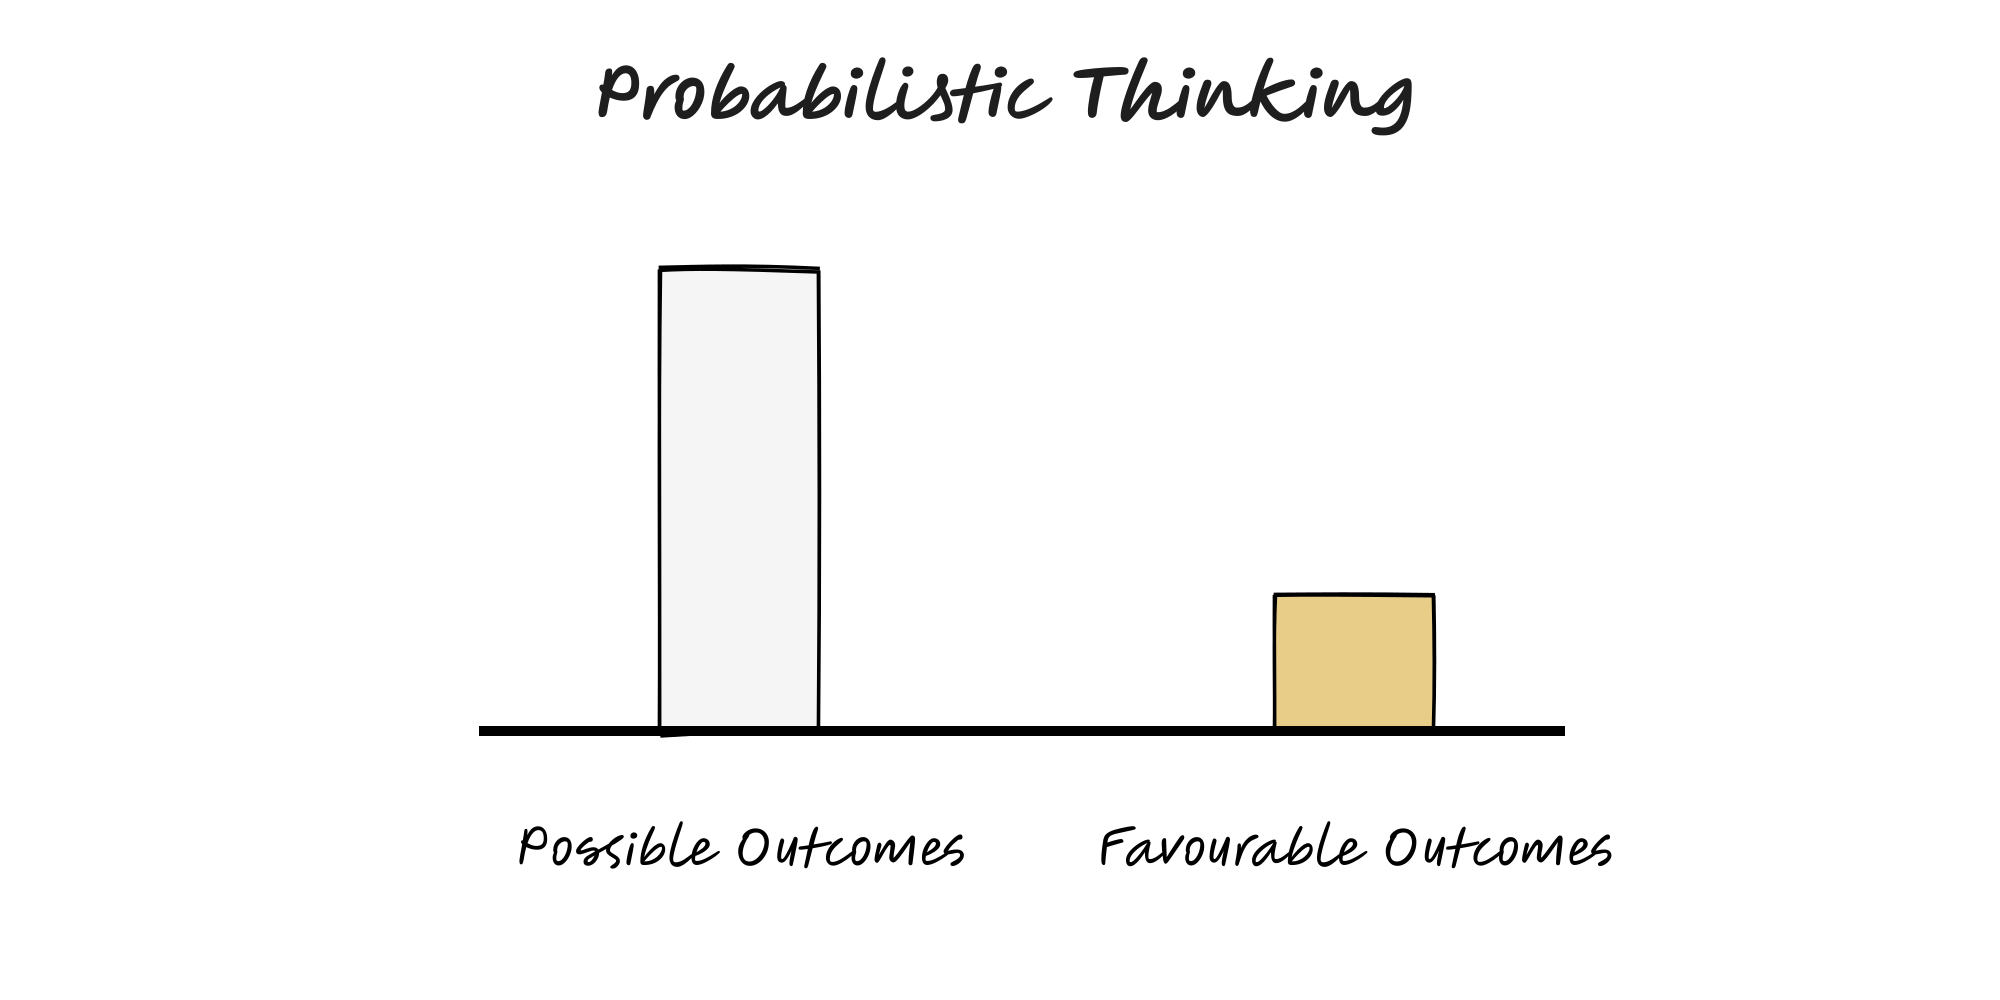
Probabilistic Thinking
Reason in degrees of belief, not certainties: use base rates, ranges, and expected value—then update as evidence arrives.
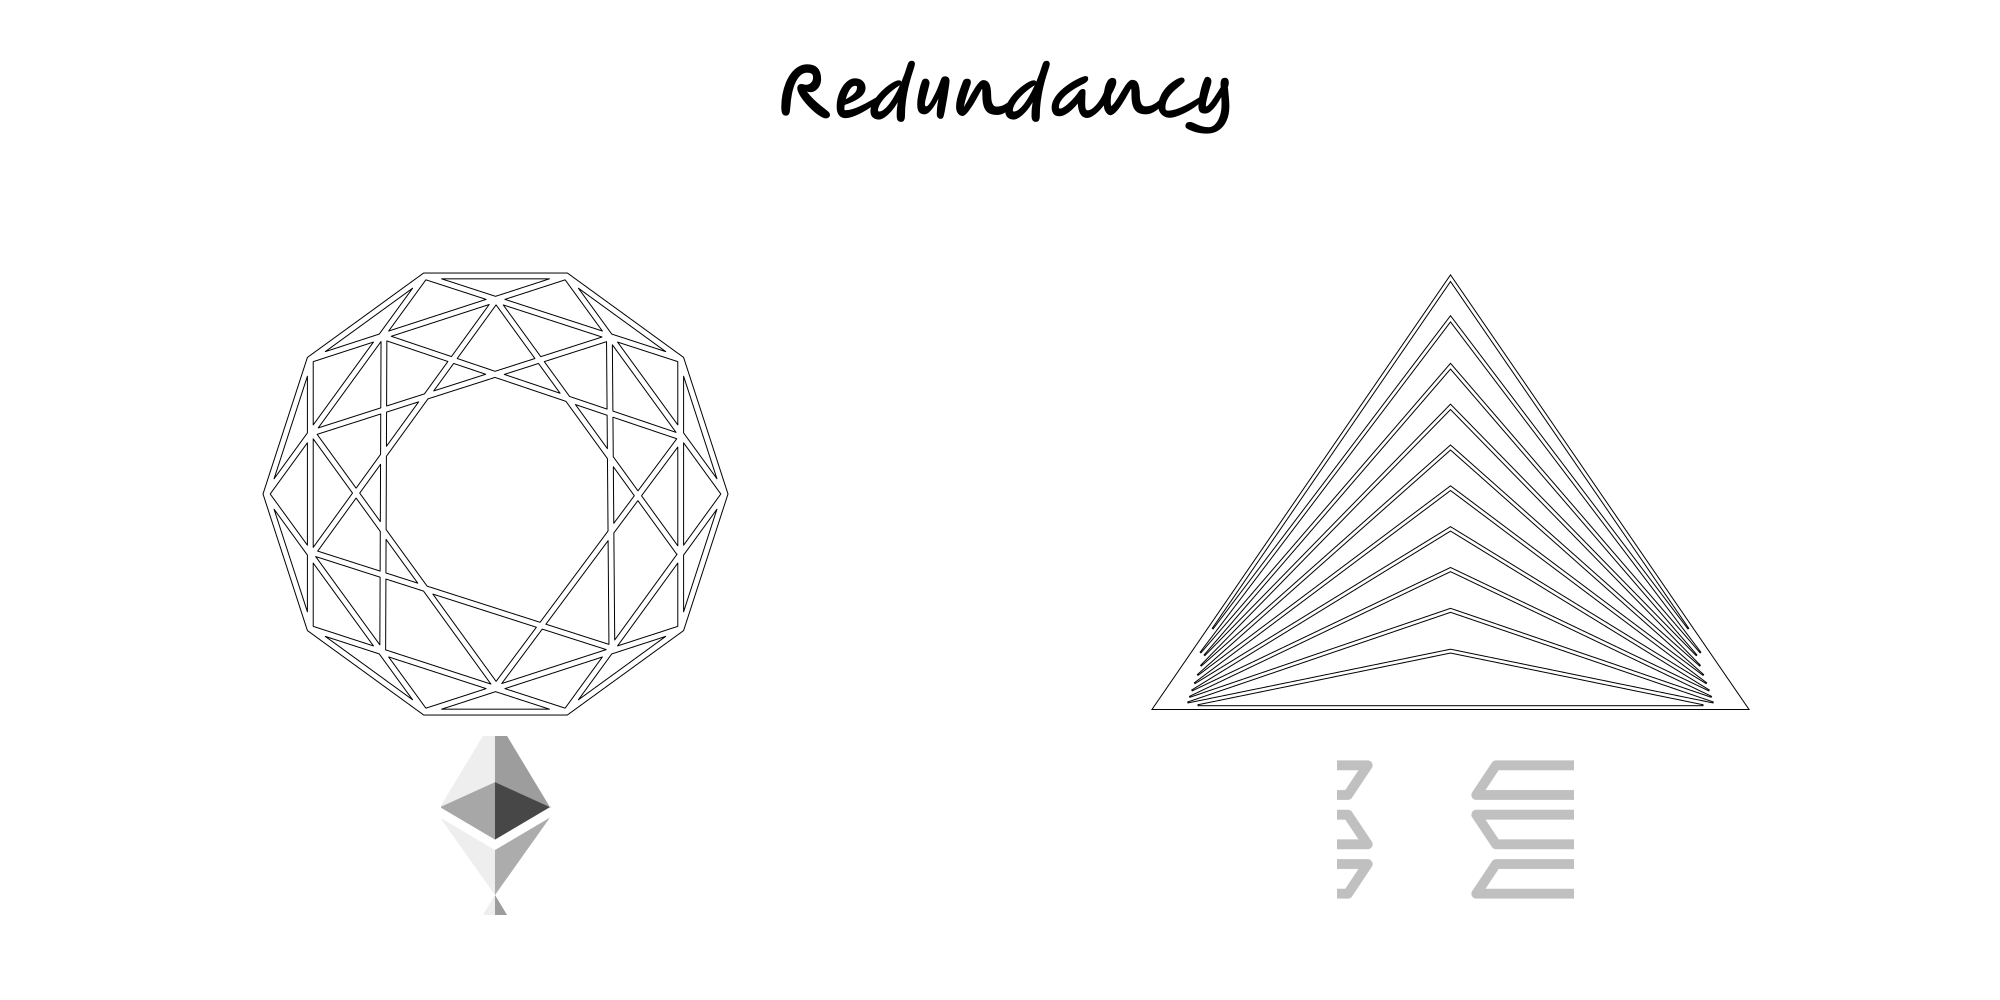
Redundancy
Add independent alternatives so one failure doesn’t stop the outcome; test failover so the backup isn’t imaginary.
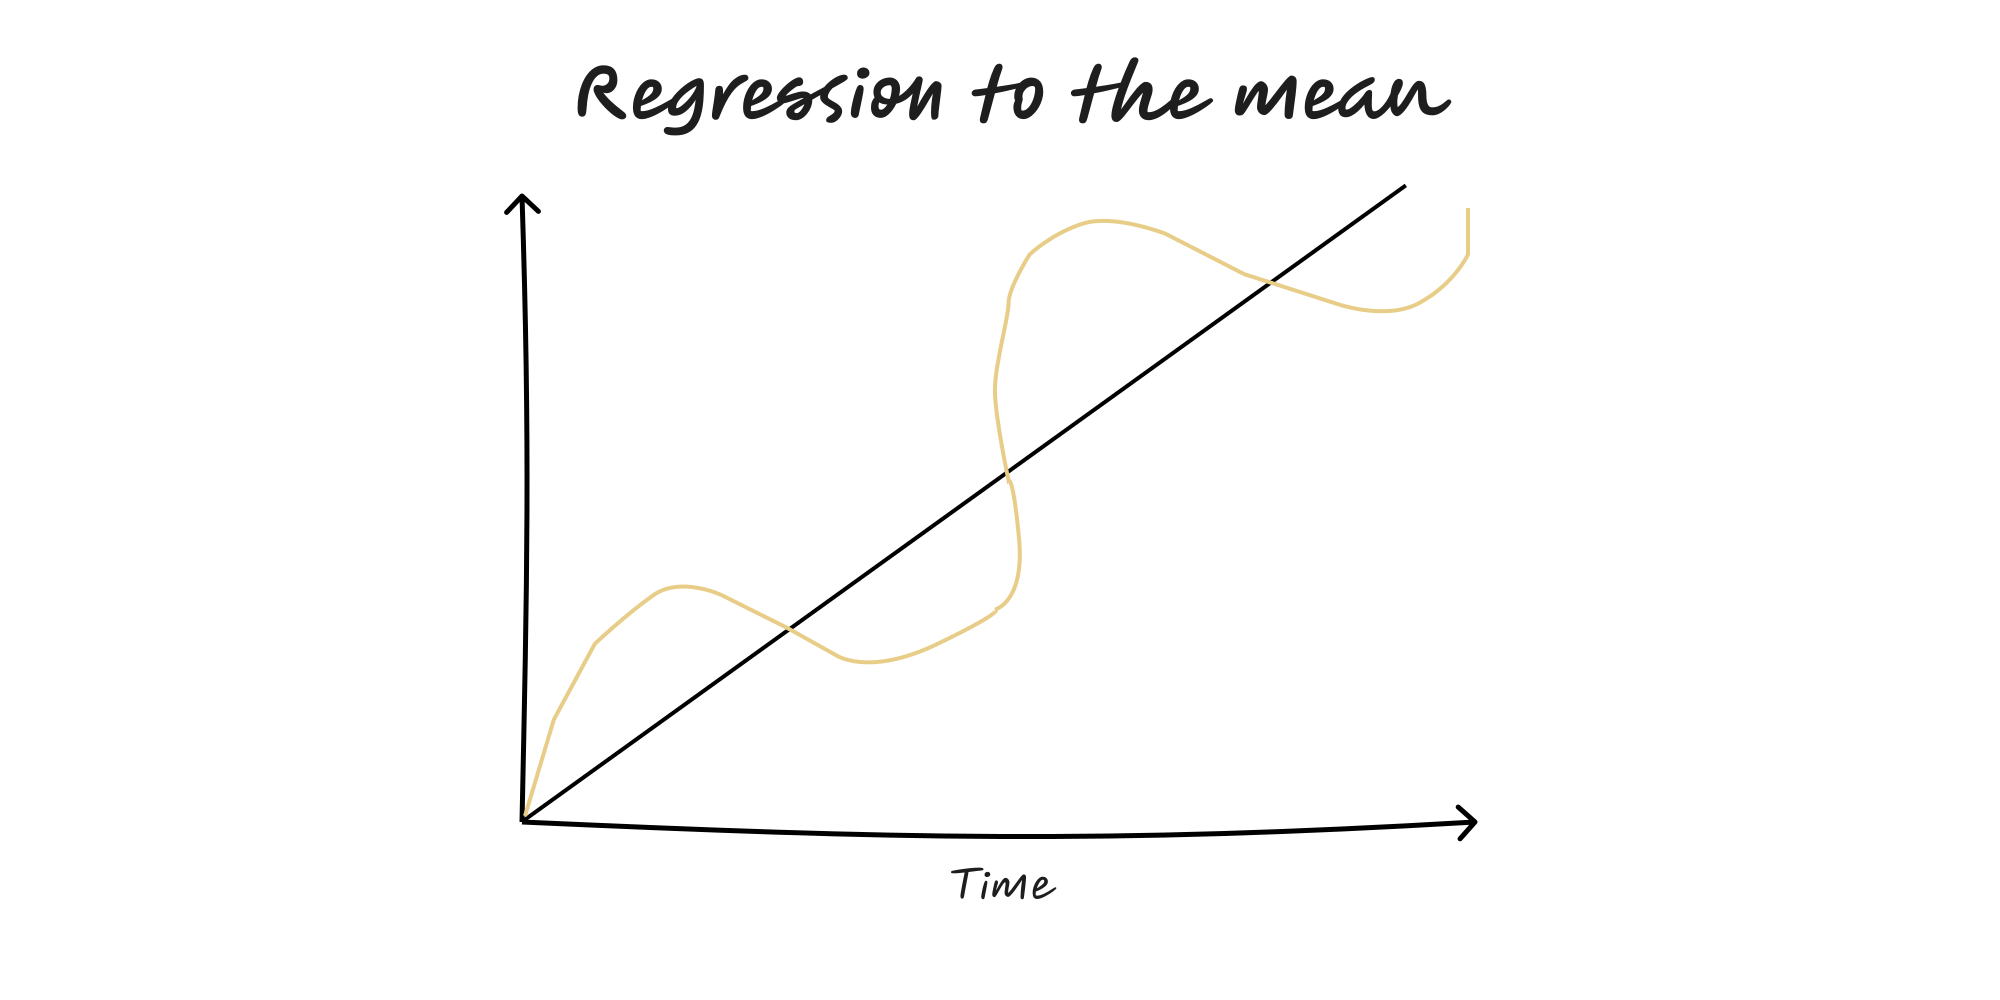
Regression to the Mean
Extreme results are usually followed by more typical ones—even without any real change.
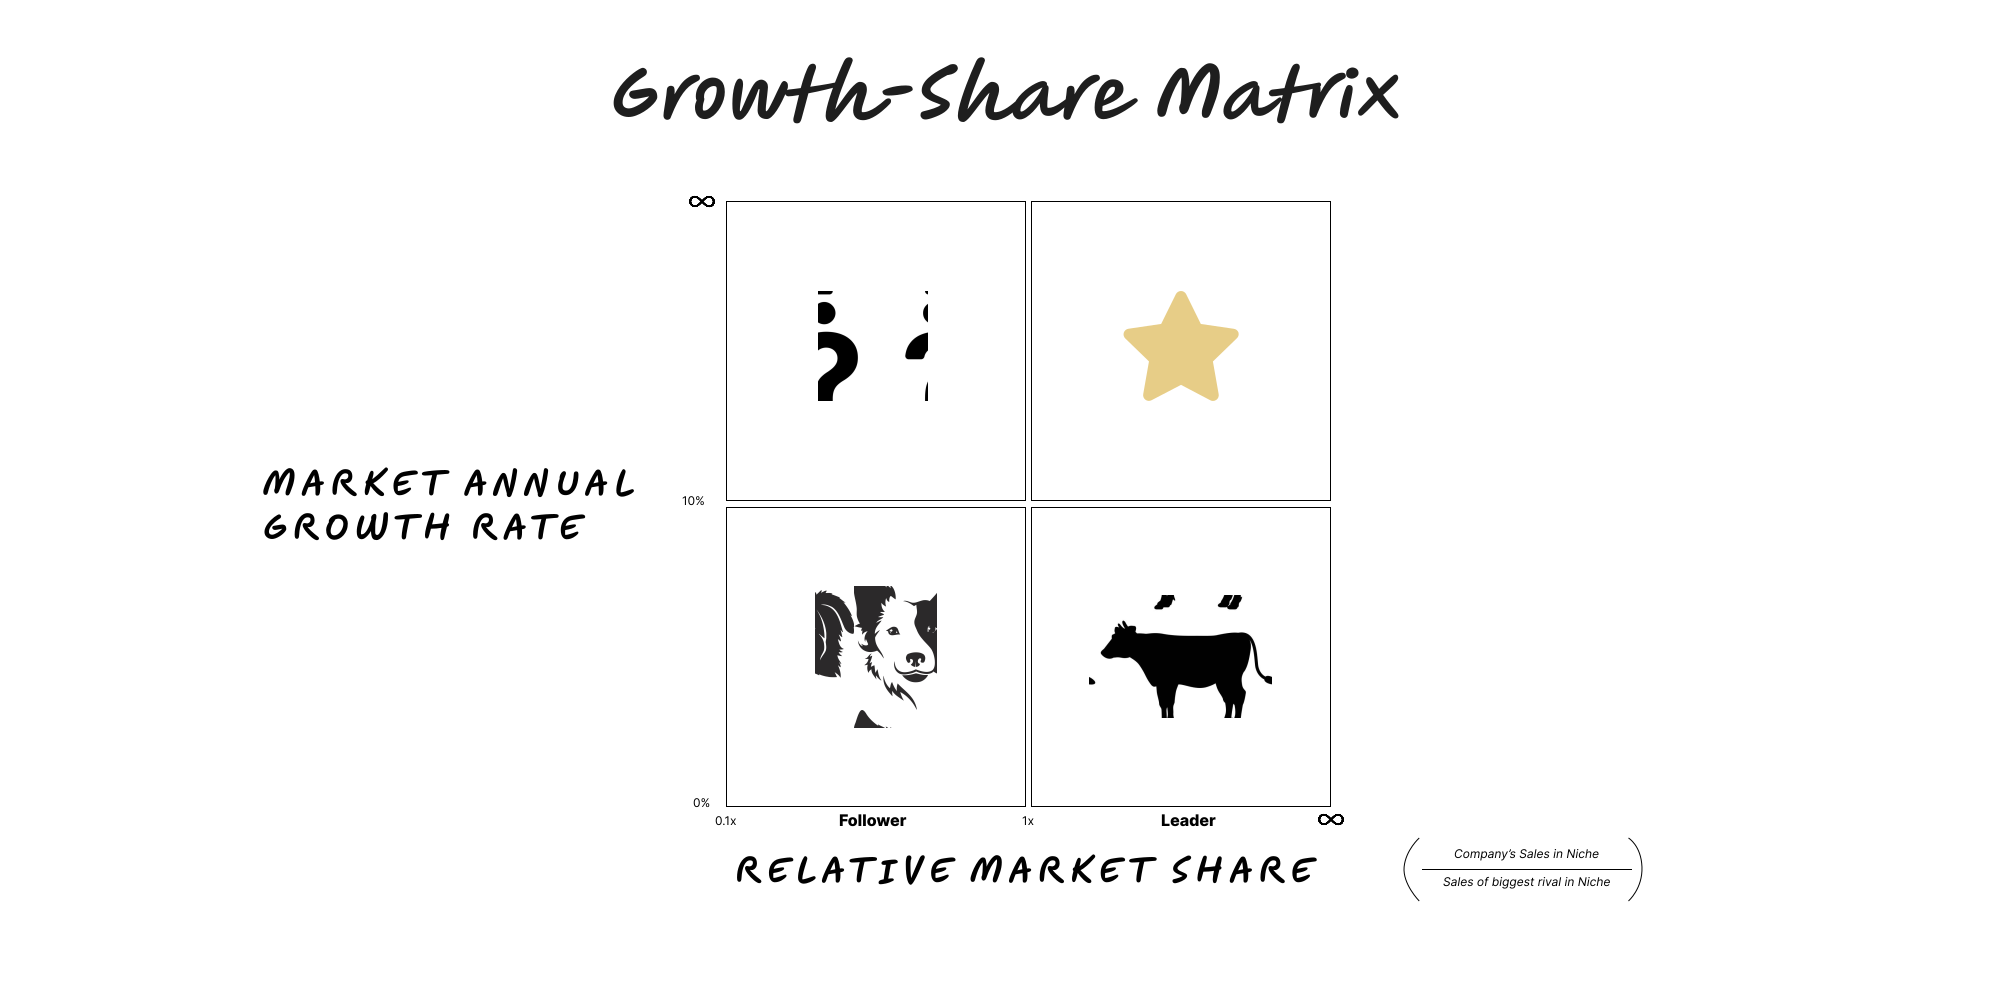
Star Principle
Richard Koch’s rule to back category leaders in high‑growth niches; leadership + growth compounding.
State → Story → Strategy
Align your state, story and strategy; order matters.
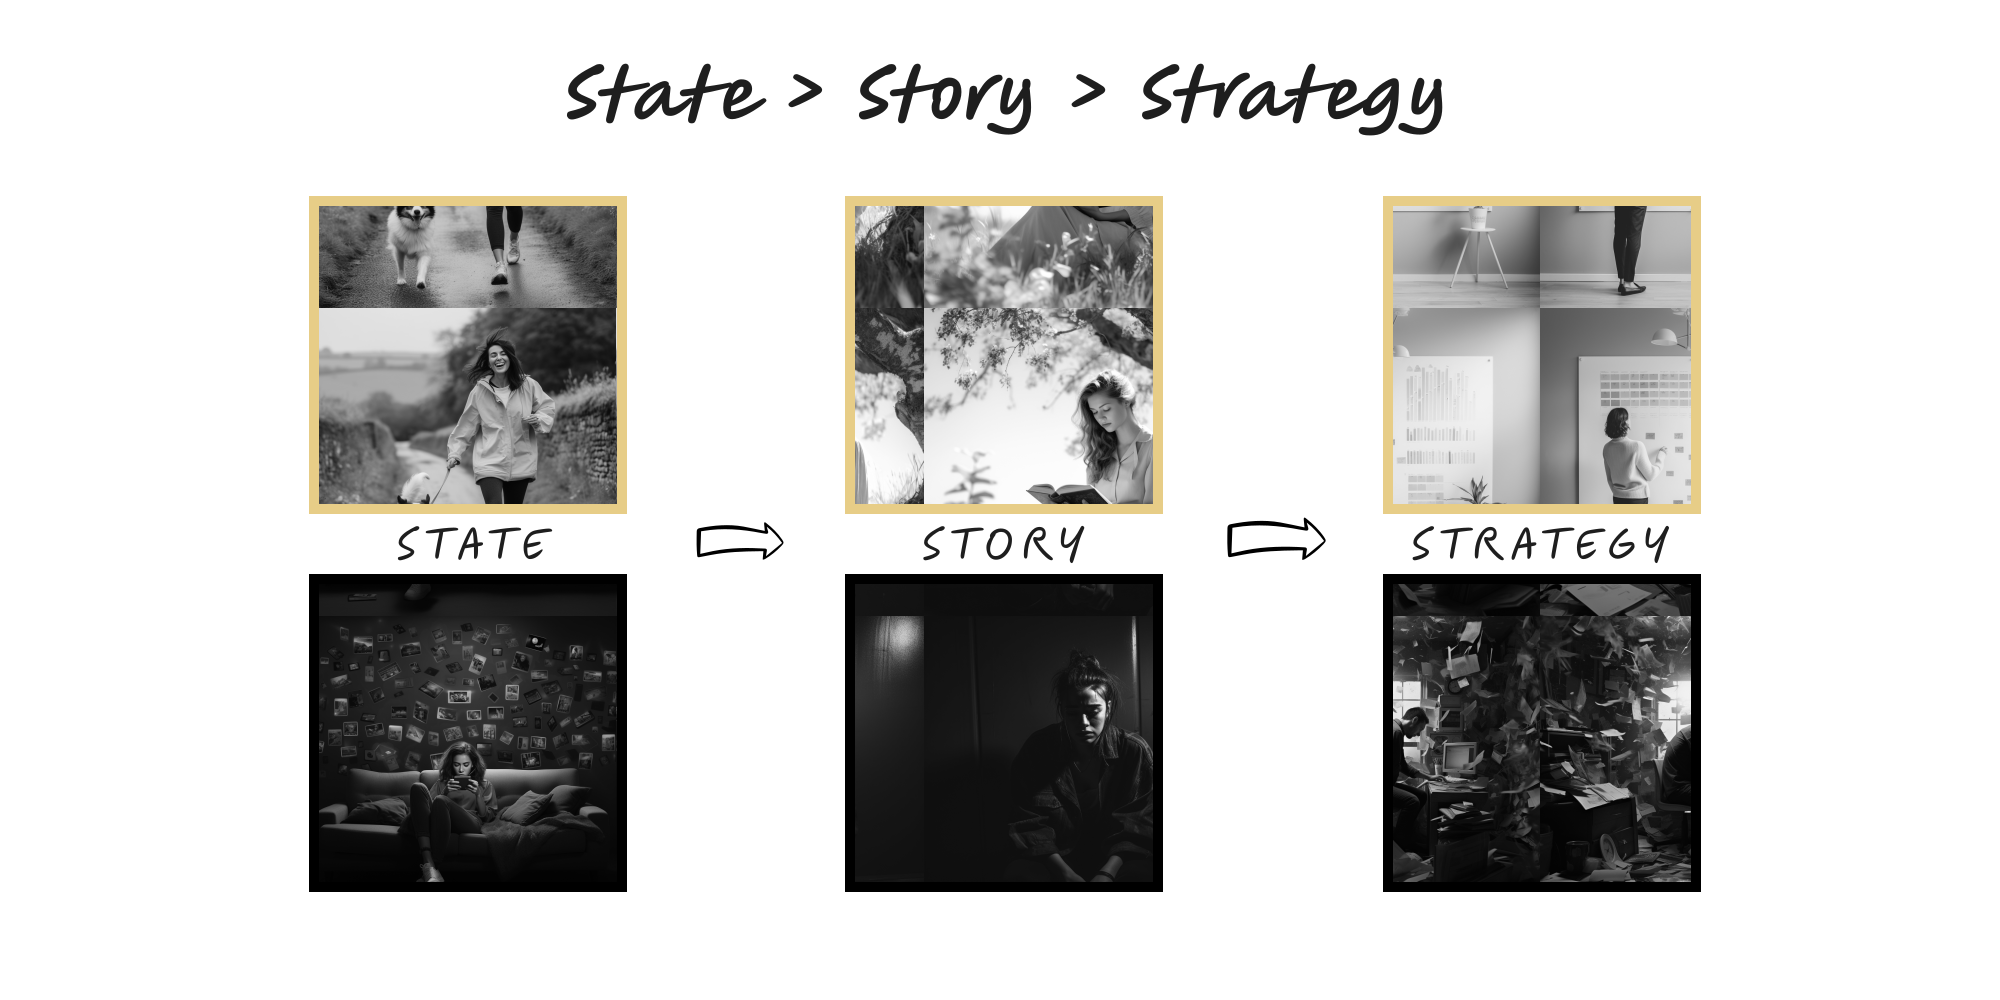
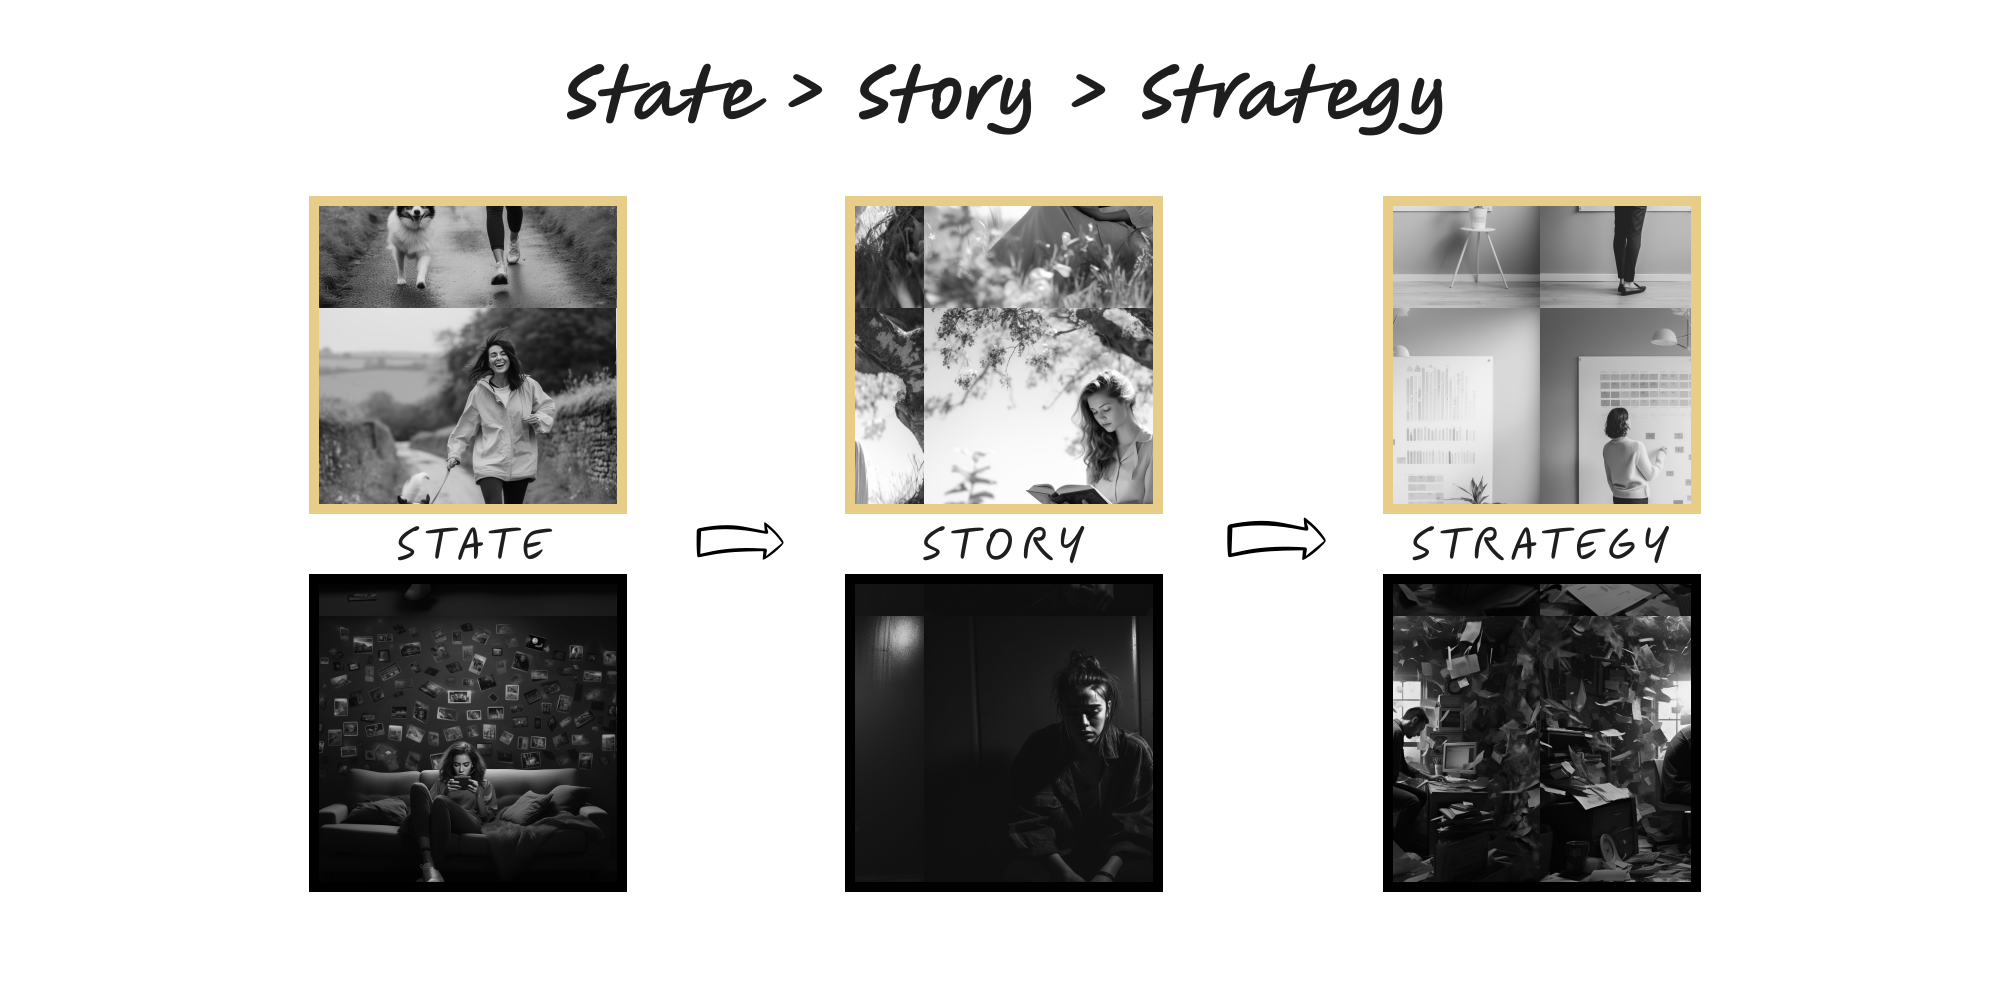
State → Story → Strategy
Align your state, story and strategy; order matters.
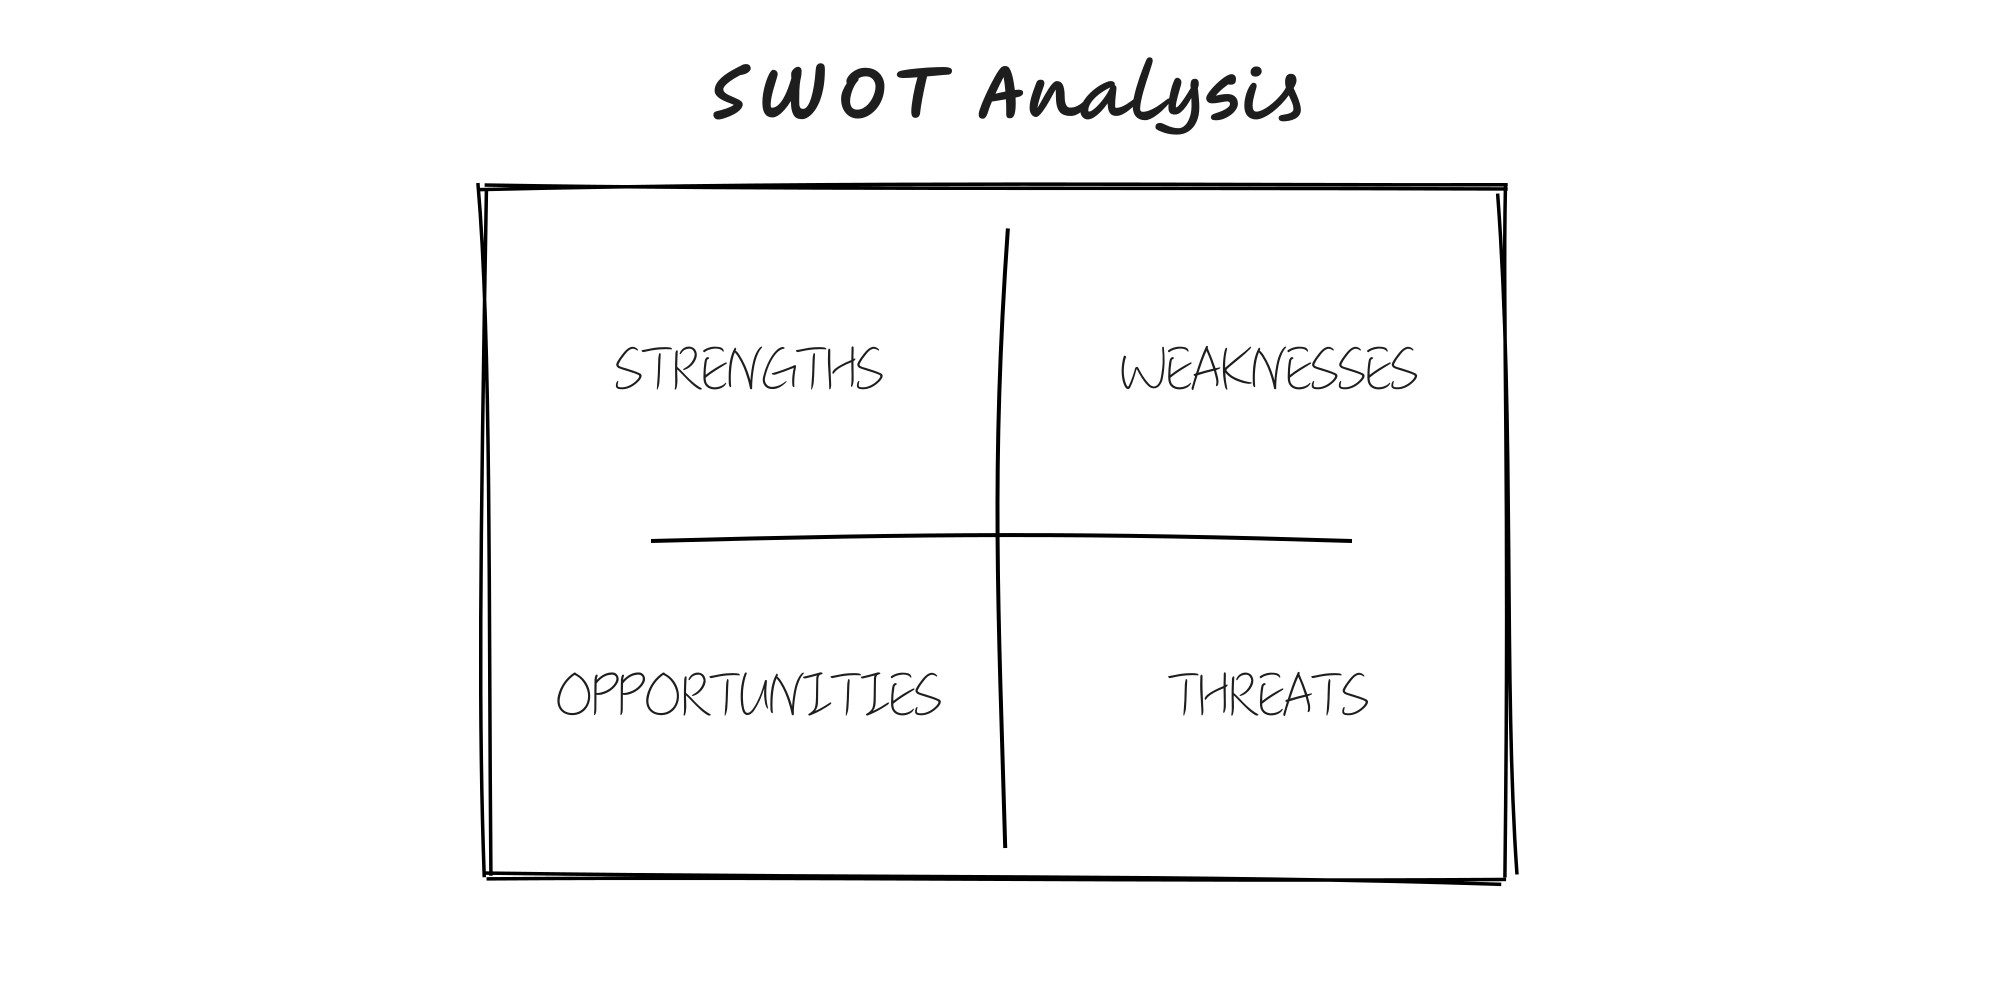
SWOT Analysis
Map internal factors (Strengths, Weaknesses) and external factors (Opportunities, Threats), then convert the grid into a short list of strategic moves.
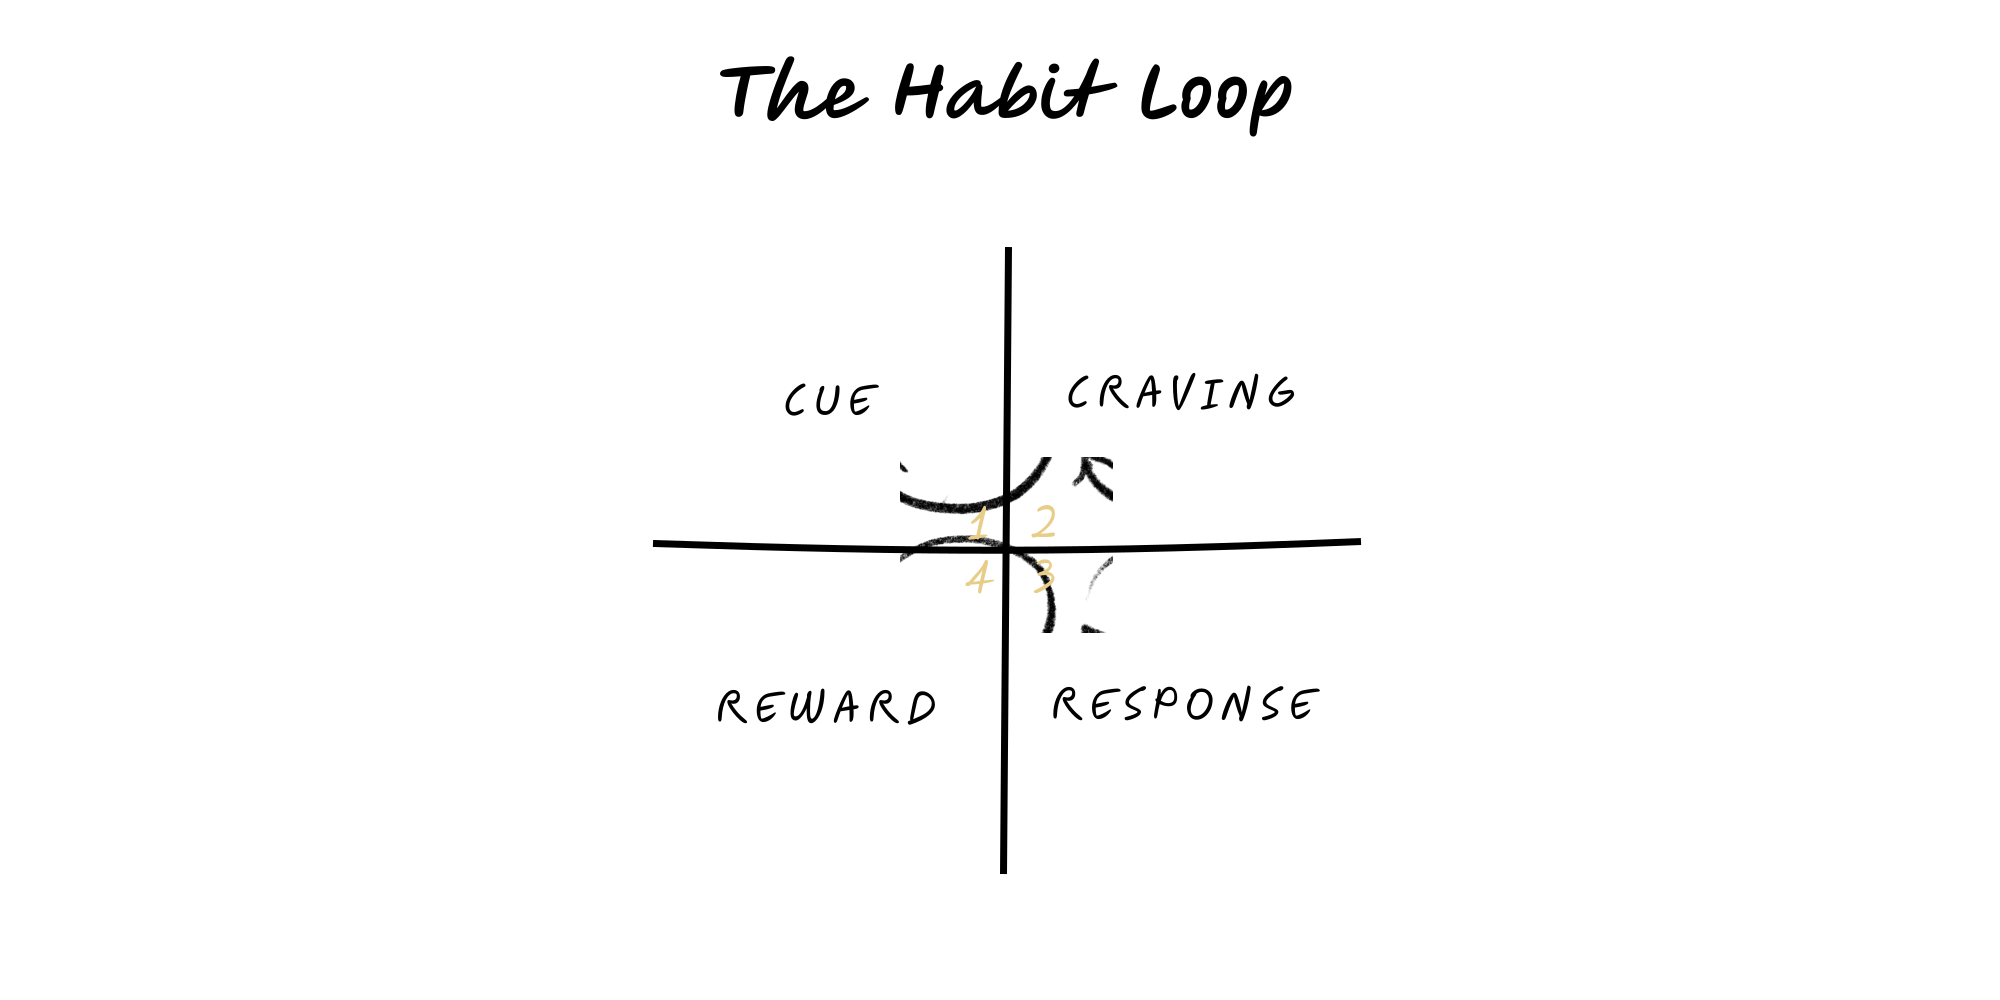
The Habit Loop
Habits run on a loop: cue → craving → response → reward. Make good loops easy and satisfying; break bad ones by keeping the cue and reward but changing the routine.
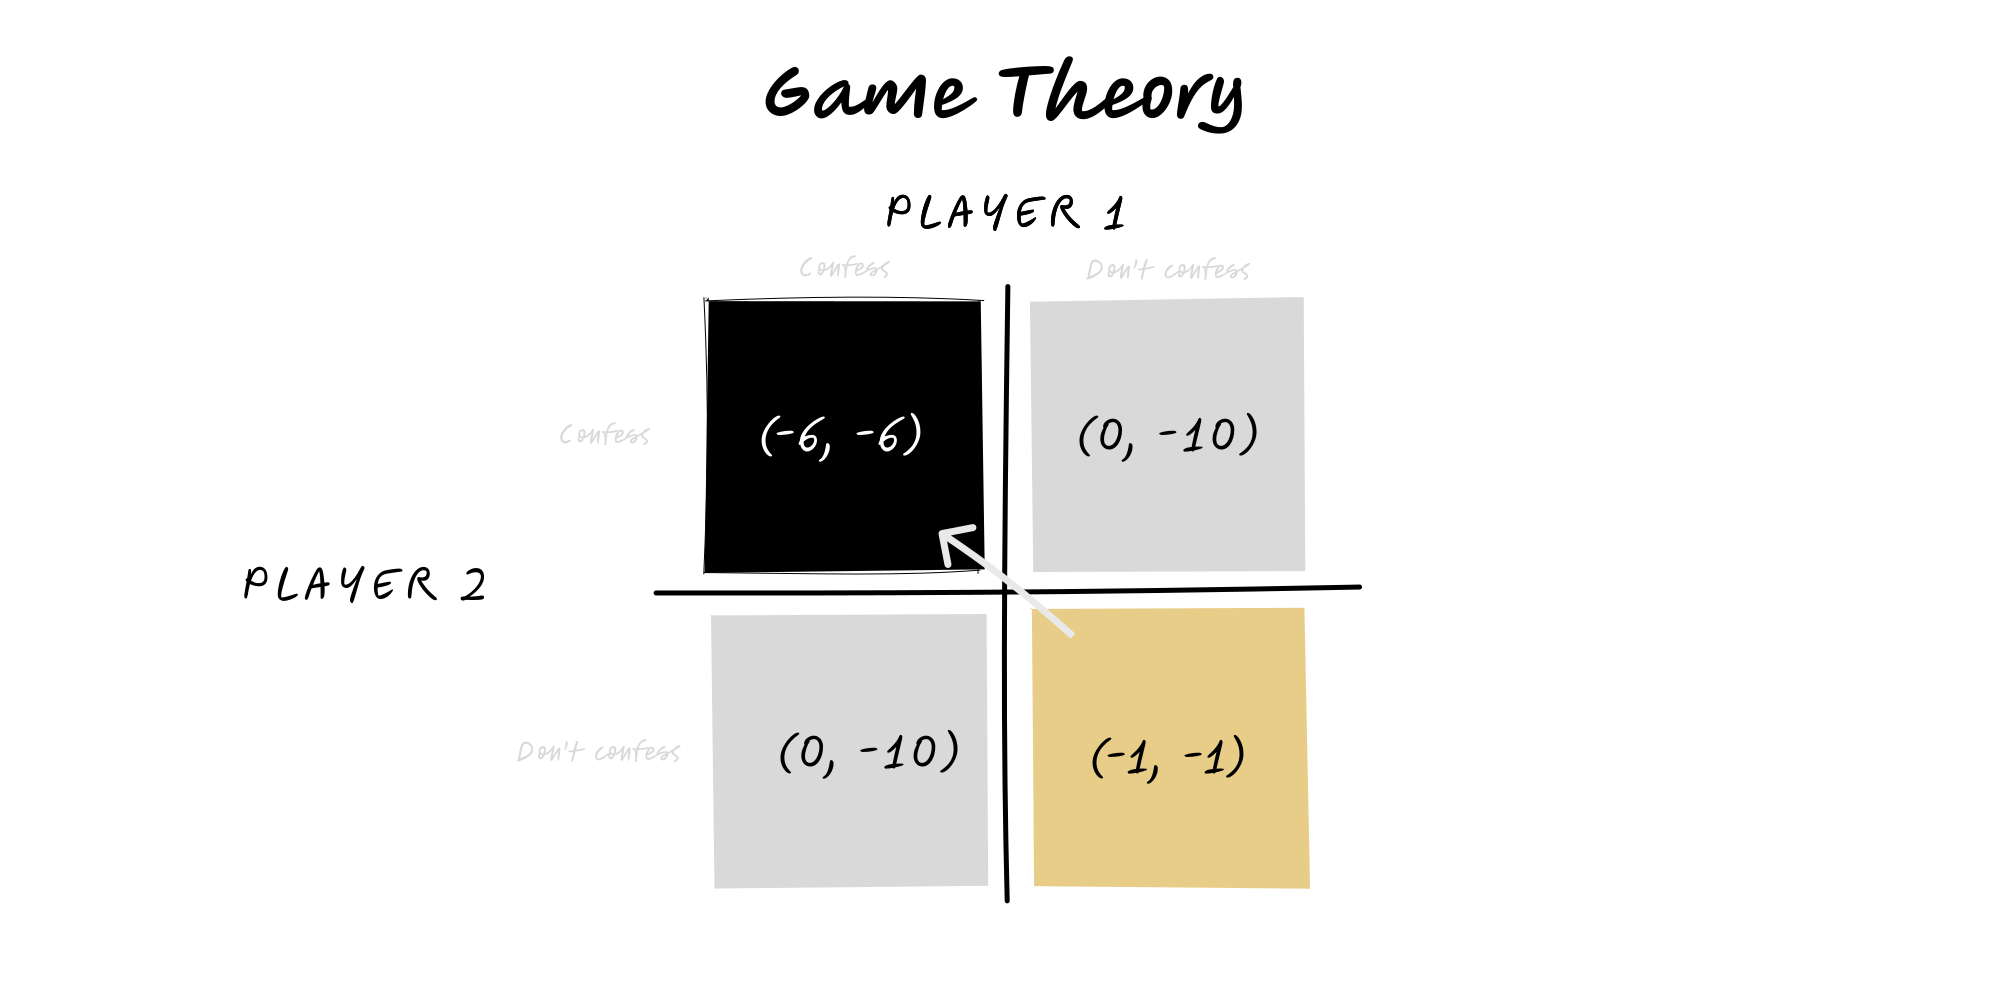
Game Theory
Model strategic situations where outcomes depend on your choice and others’ choices—then design moves or rules to shift the equilibrium.
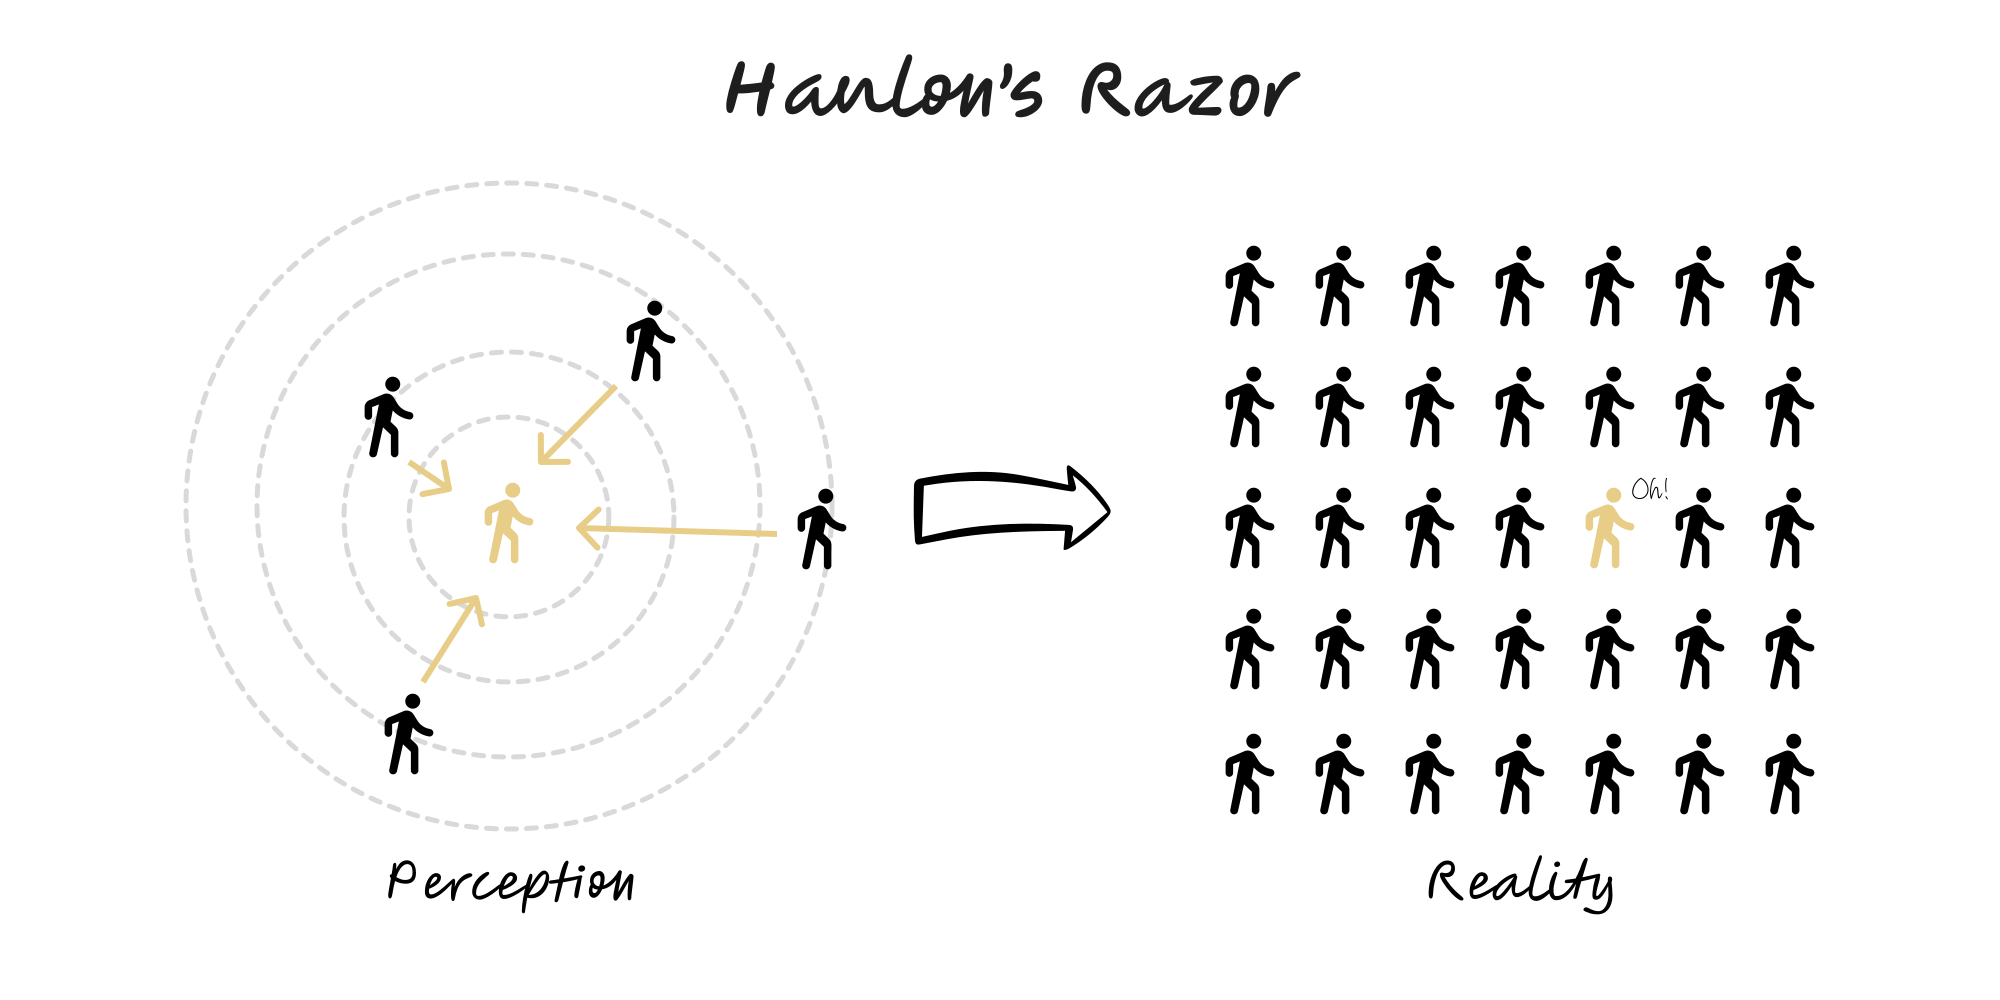
Hanlon’s Razor
Don’t attribute to malice what can be explained by error, ignorance or misaligned incentives.
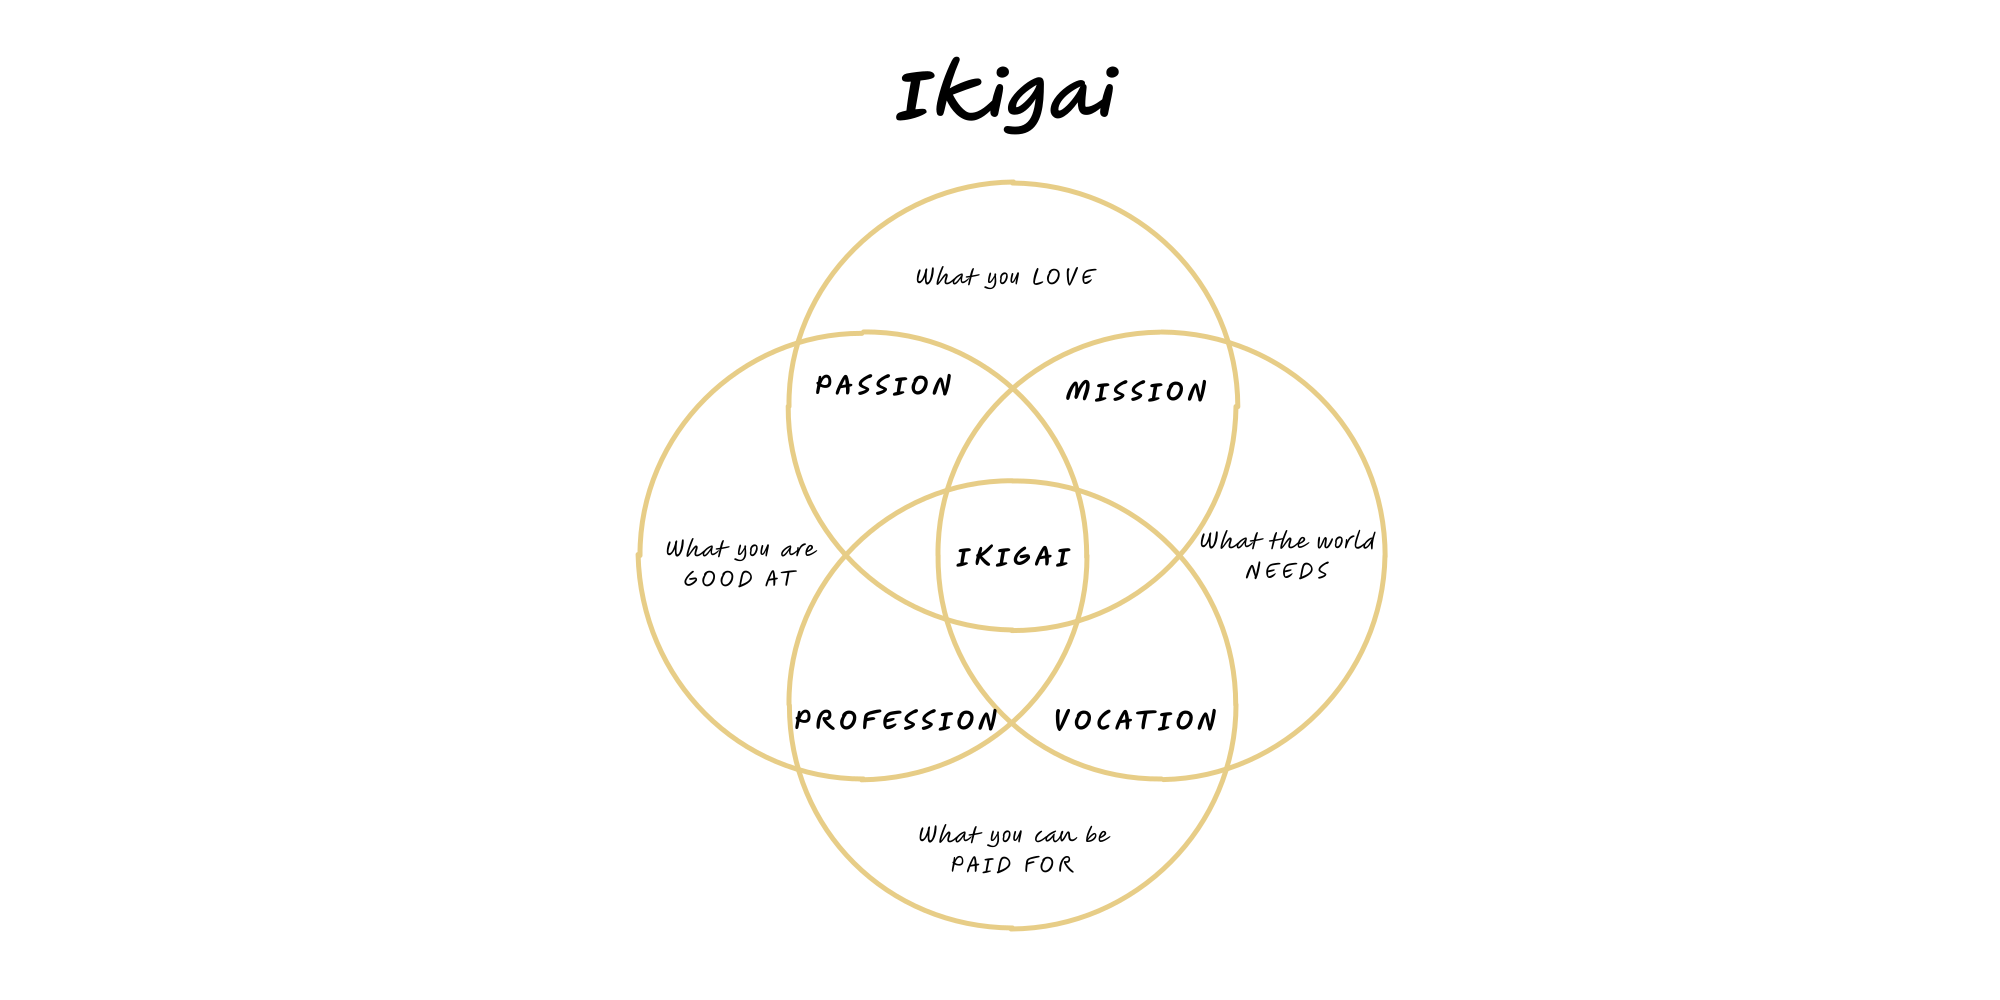
Ikigai
A practical way to align what you love, what you’re good at, what the world needs, and what pays—while honouring small, everyday sources of meaning.
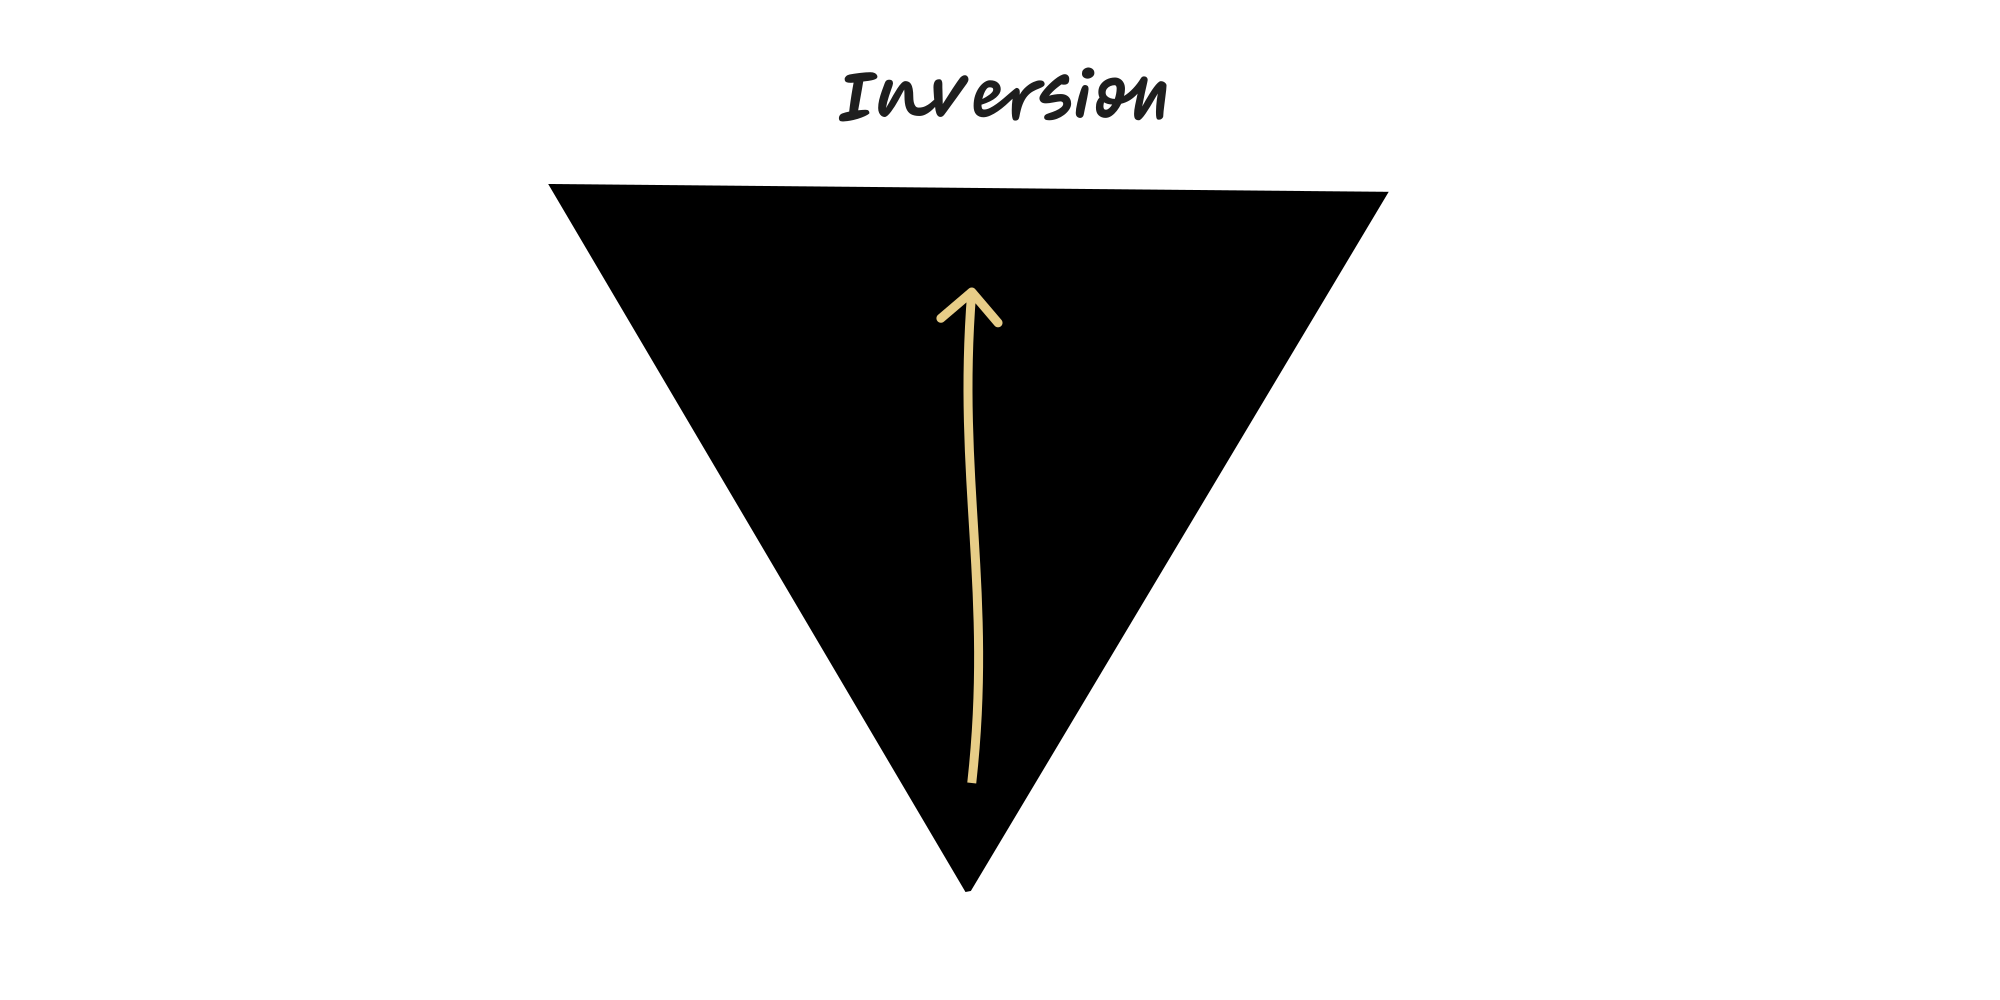
Inversion
Think backwards: define failure and remove its causes; ask the inverse question to see blind spots.
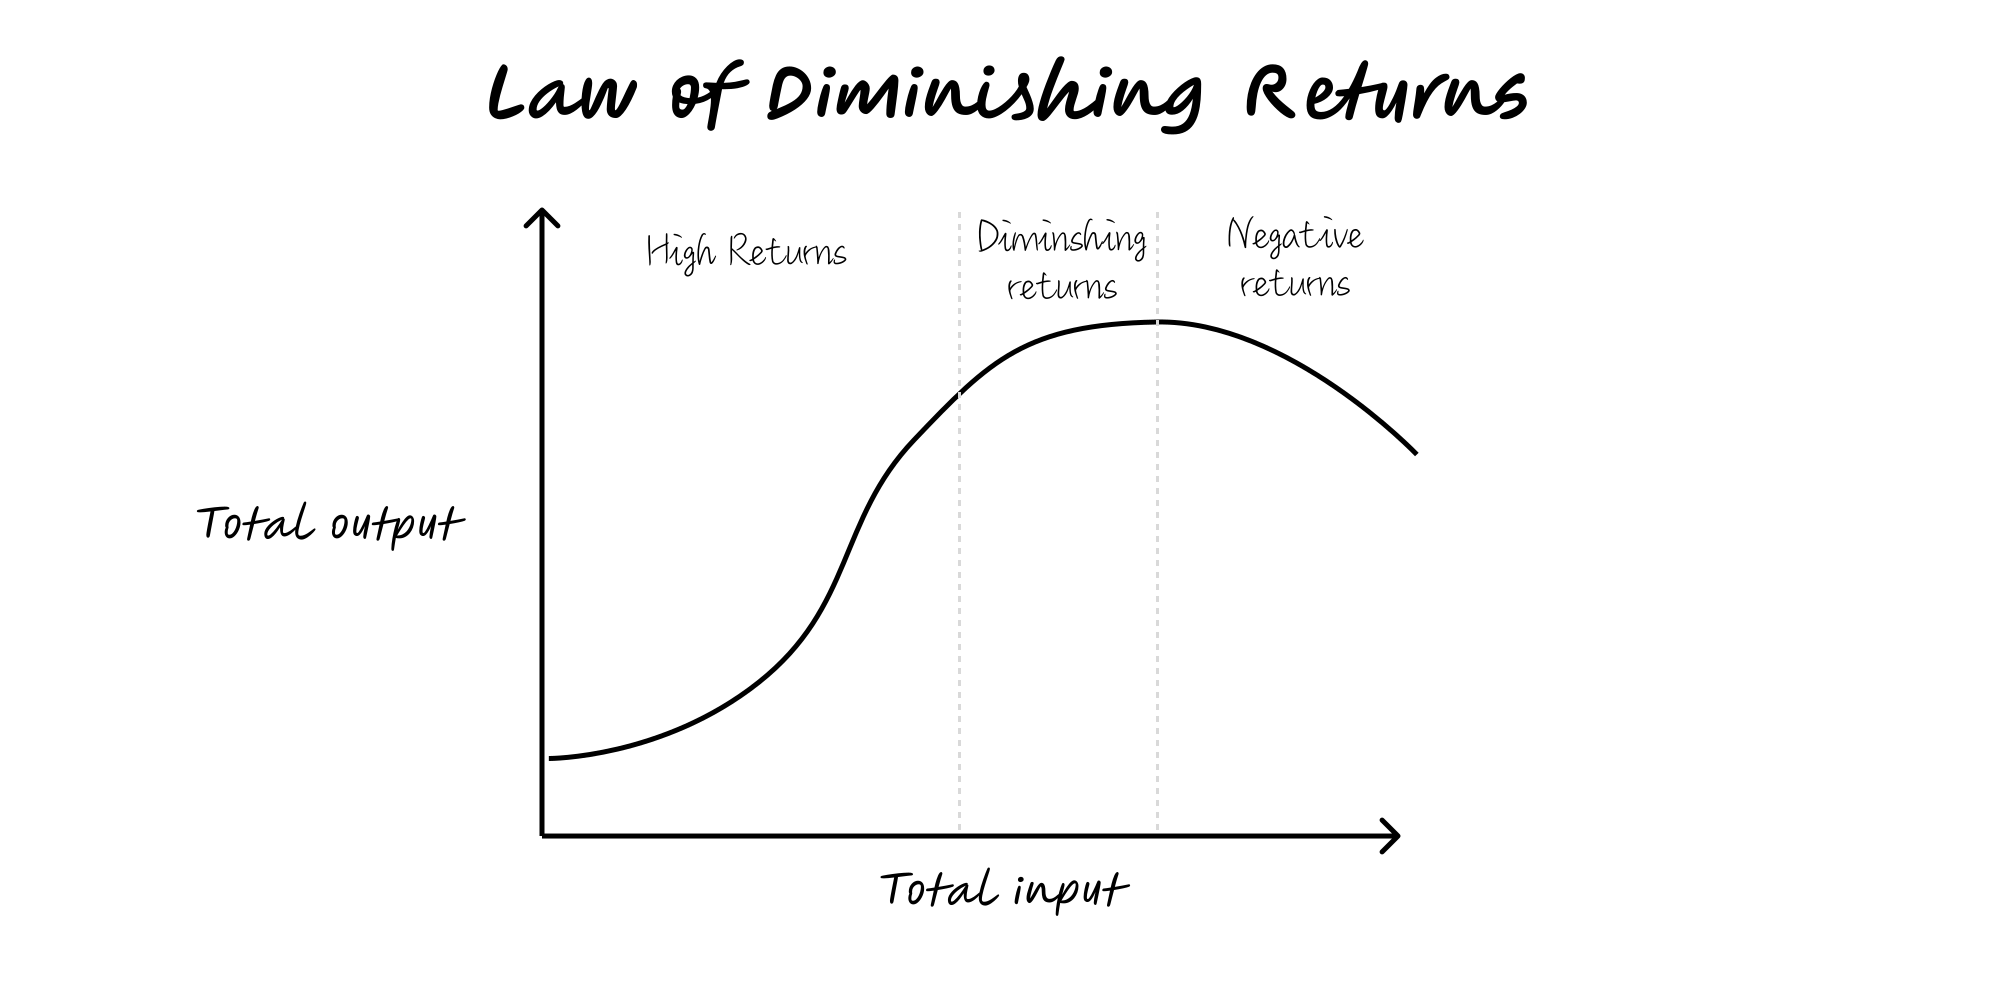
Law of Diminishing Returns
Each extra unit adds less benefit beyond a point; invest until marginal benefit ≈ marginal cost.
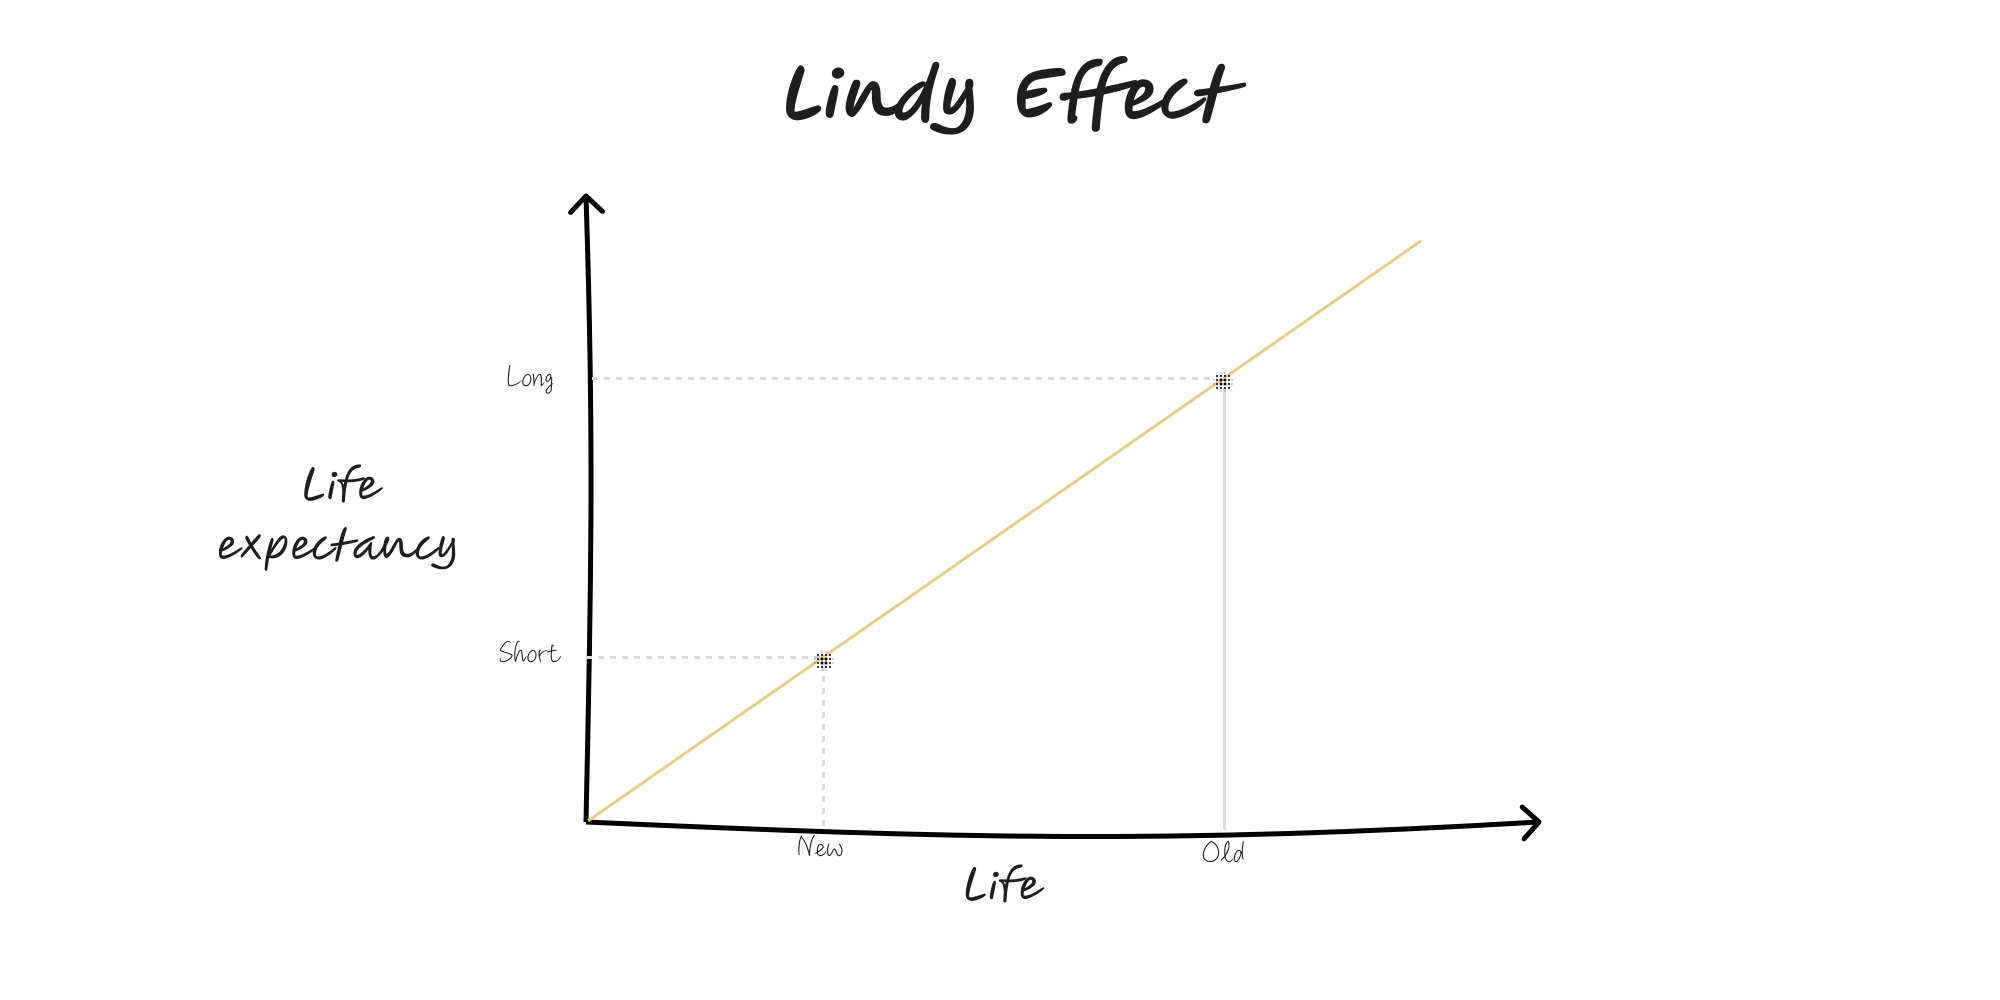
Lindy Effect
For non-perishable things (ideas, books, protocols), the older it is, the longer it’s likely to last.
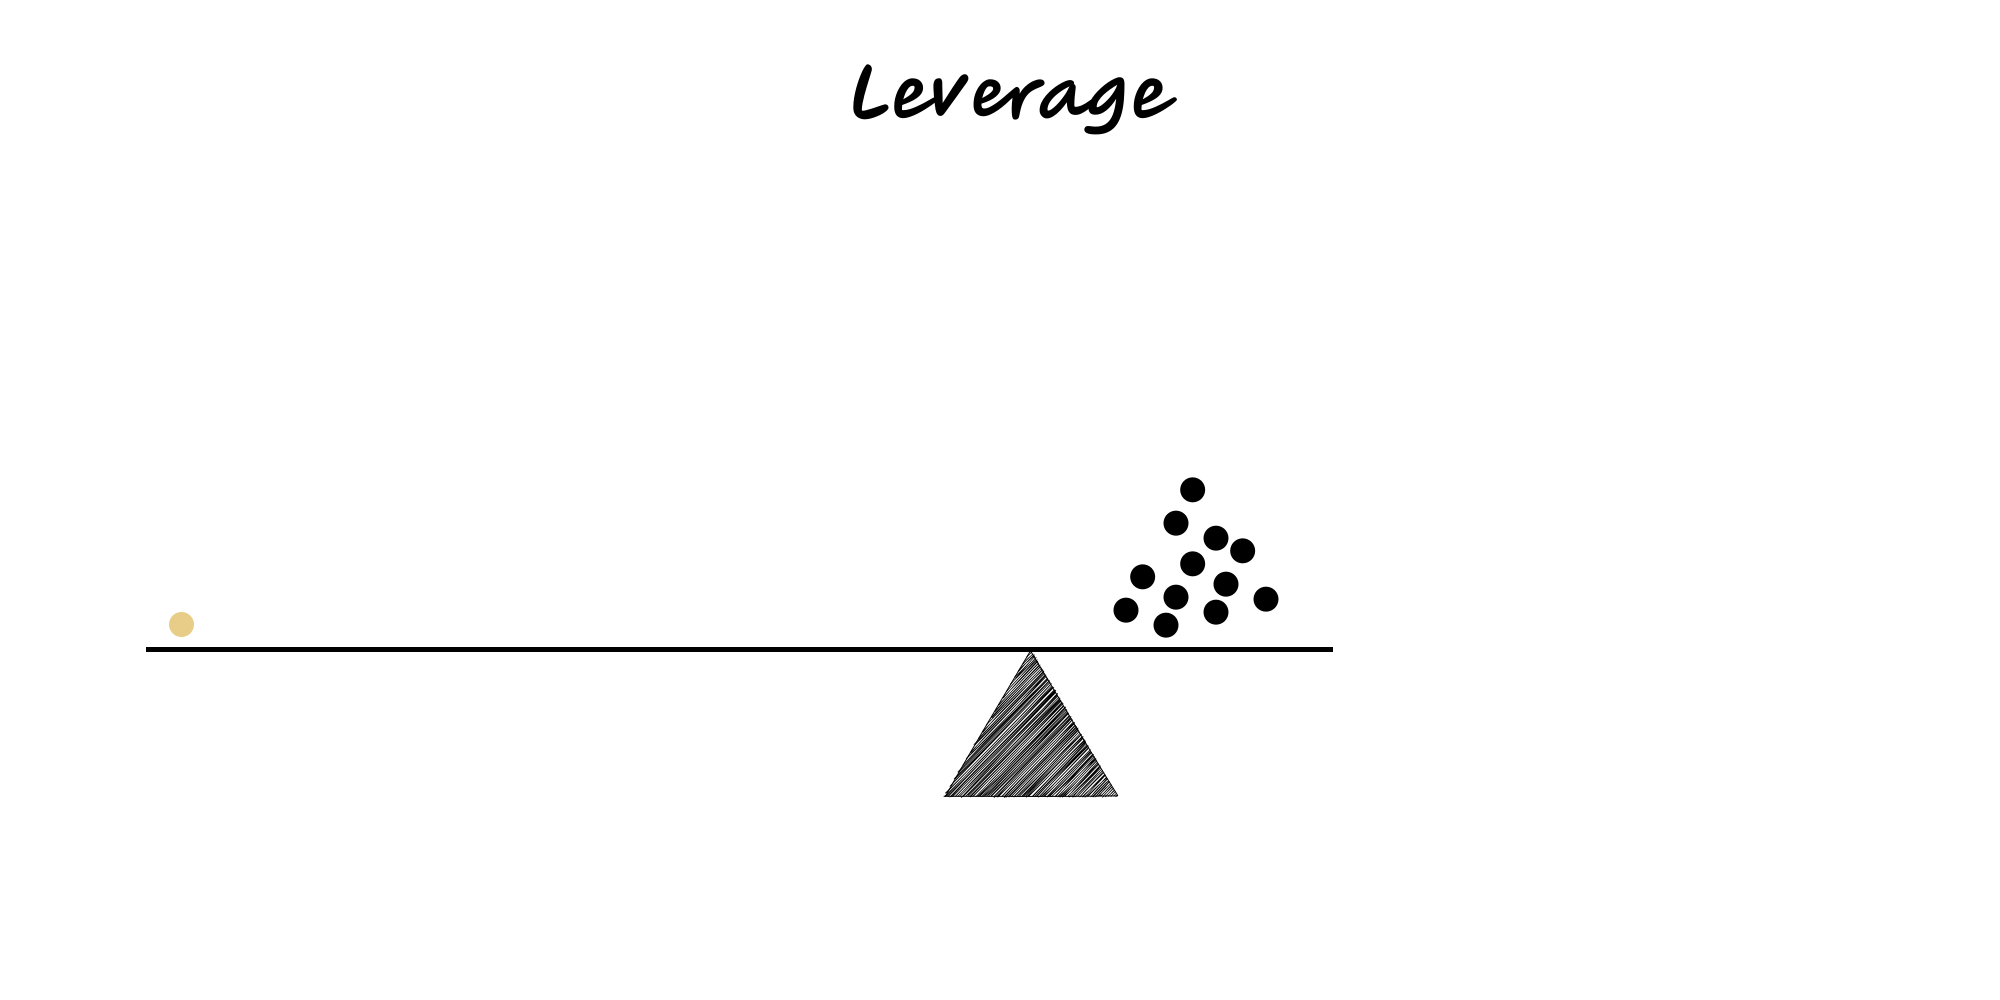
Leverage
Use small inputs to create large outputs by applying amplifiers — capital, code, media, process, partnerships. Leverage magnifies both gains and losses.
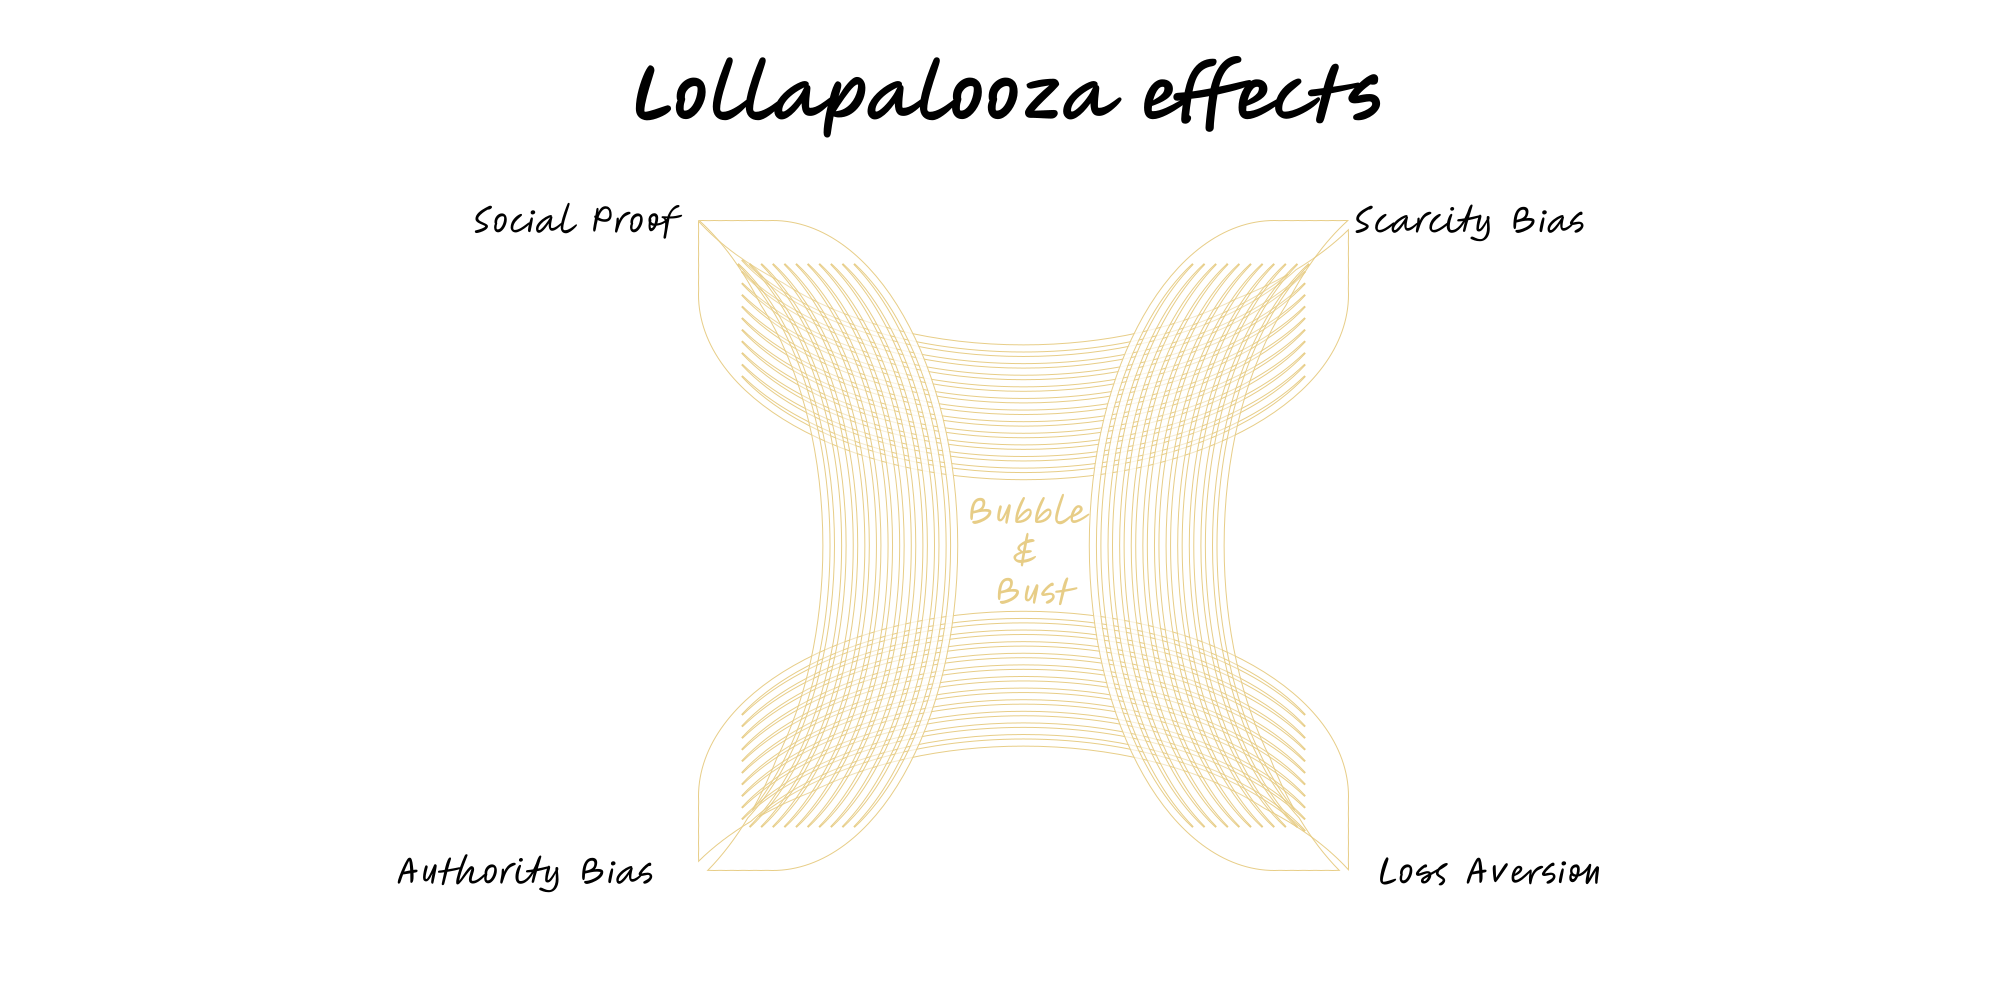
Lollapalooza Effects
Munger’s term for multiple biases/incentives acting together to produce extreme outcomes.
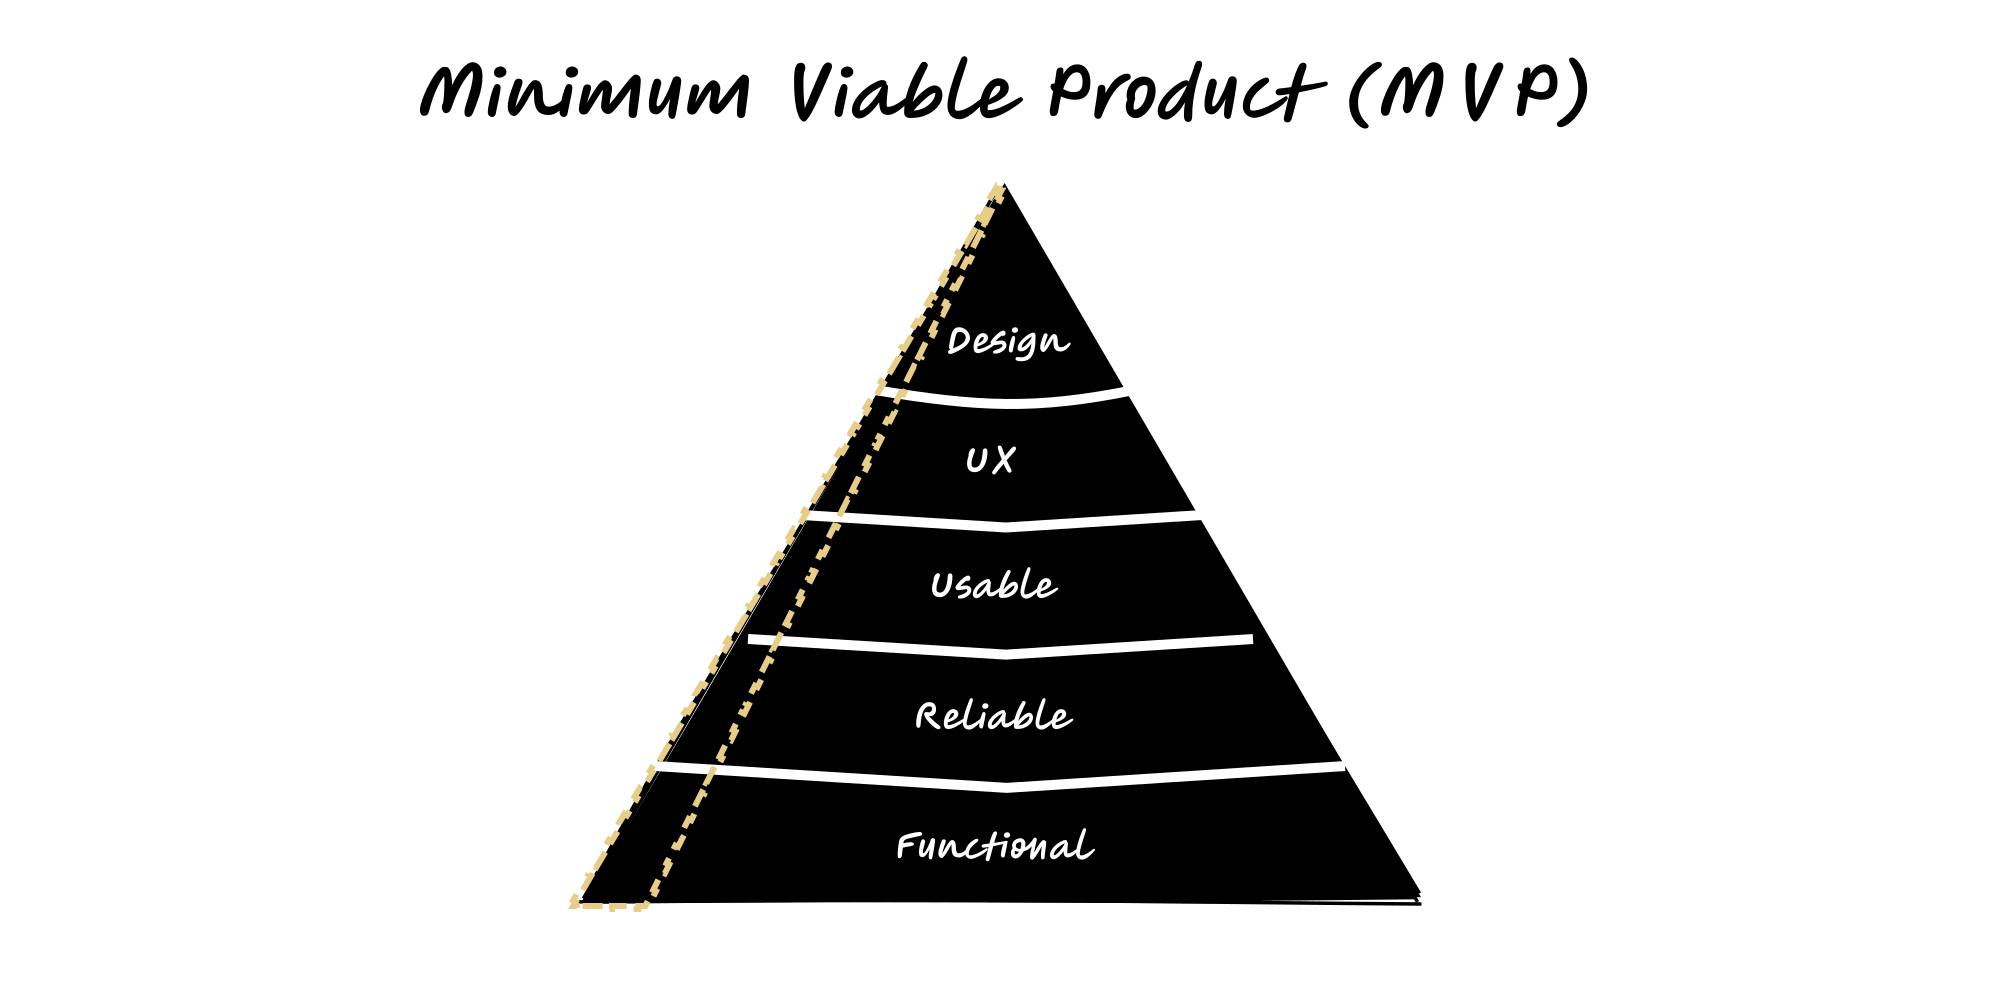
Minimum Viable Product
Build the smallest thing that tests the riskiest assumption with real users, measure what matters, and decide to pivot, persist, or kill.
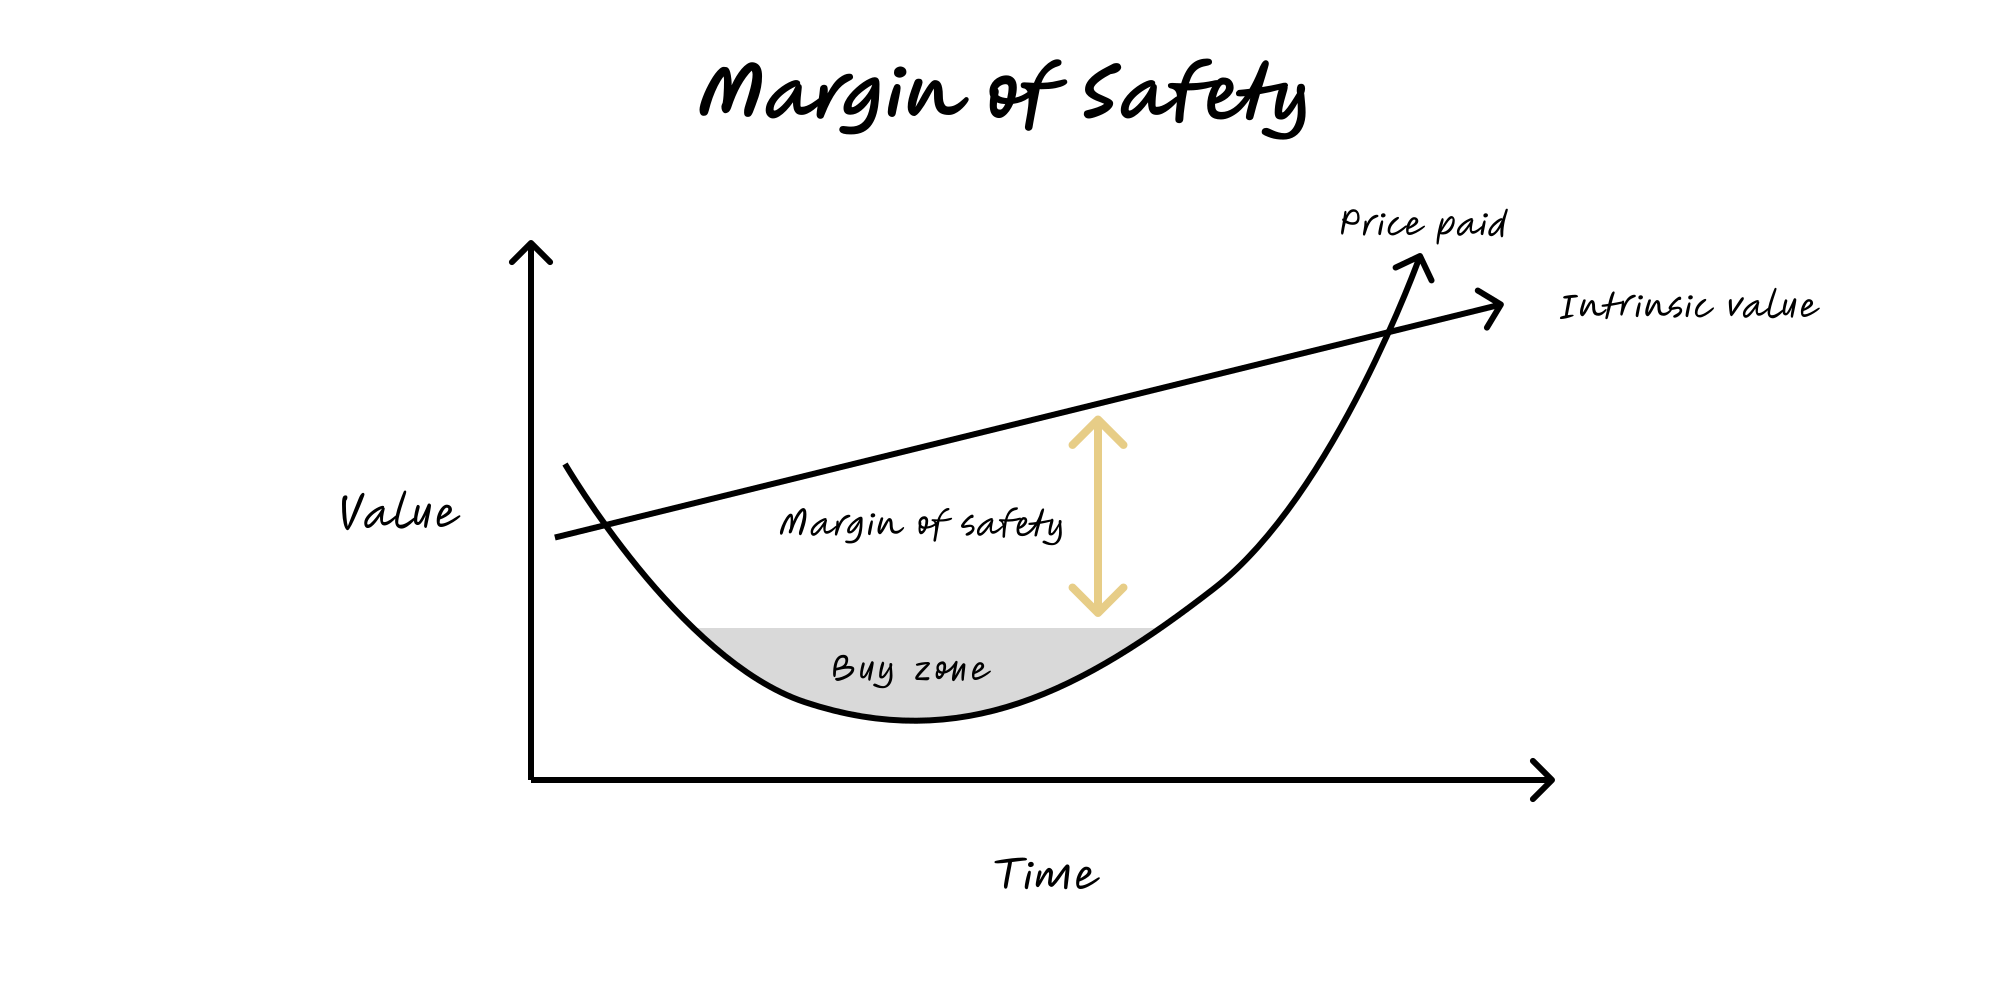
Margin of Safety
Deliberately leave room for error—buy below value, build above load, plan beyond the optimistic case—so mistakes and volatility don’t cause ruin.
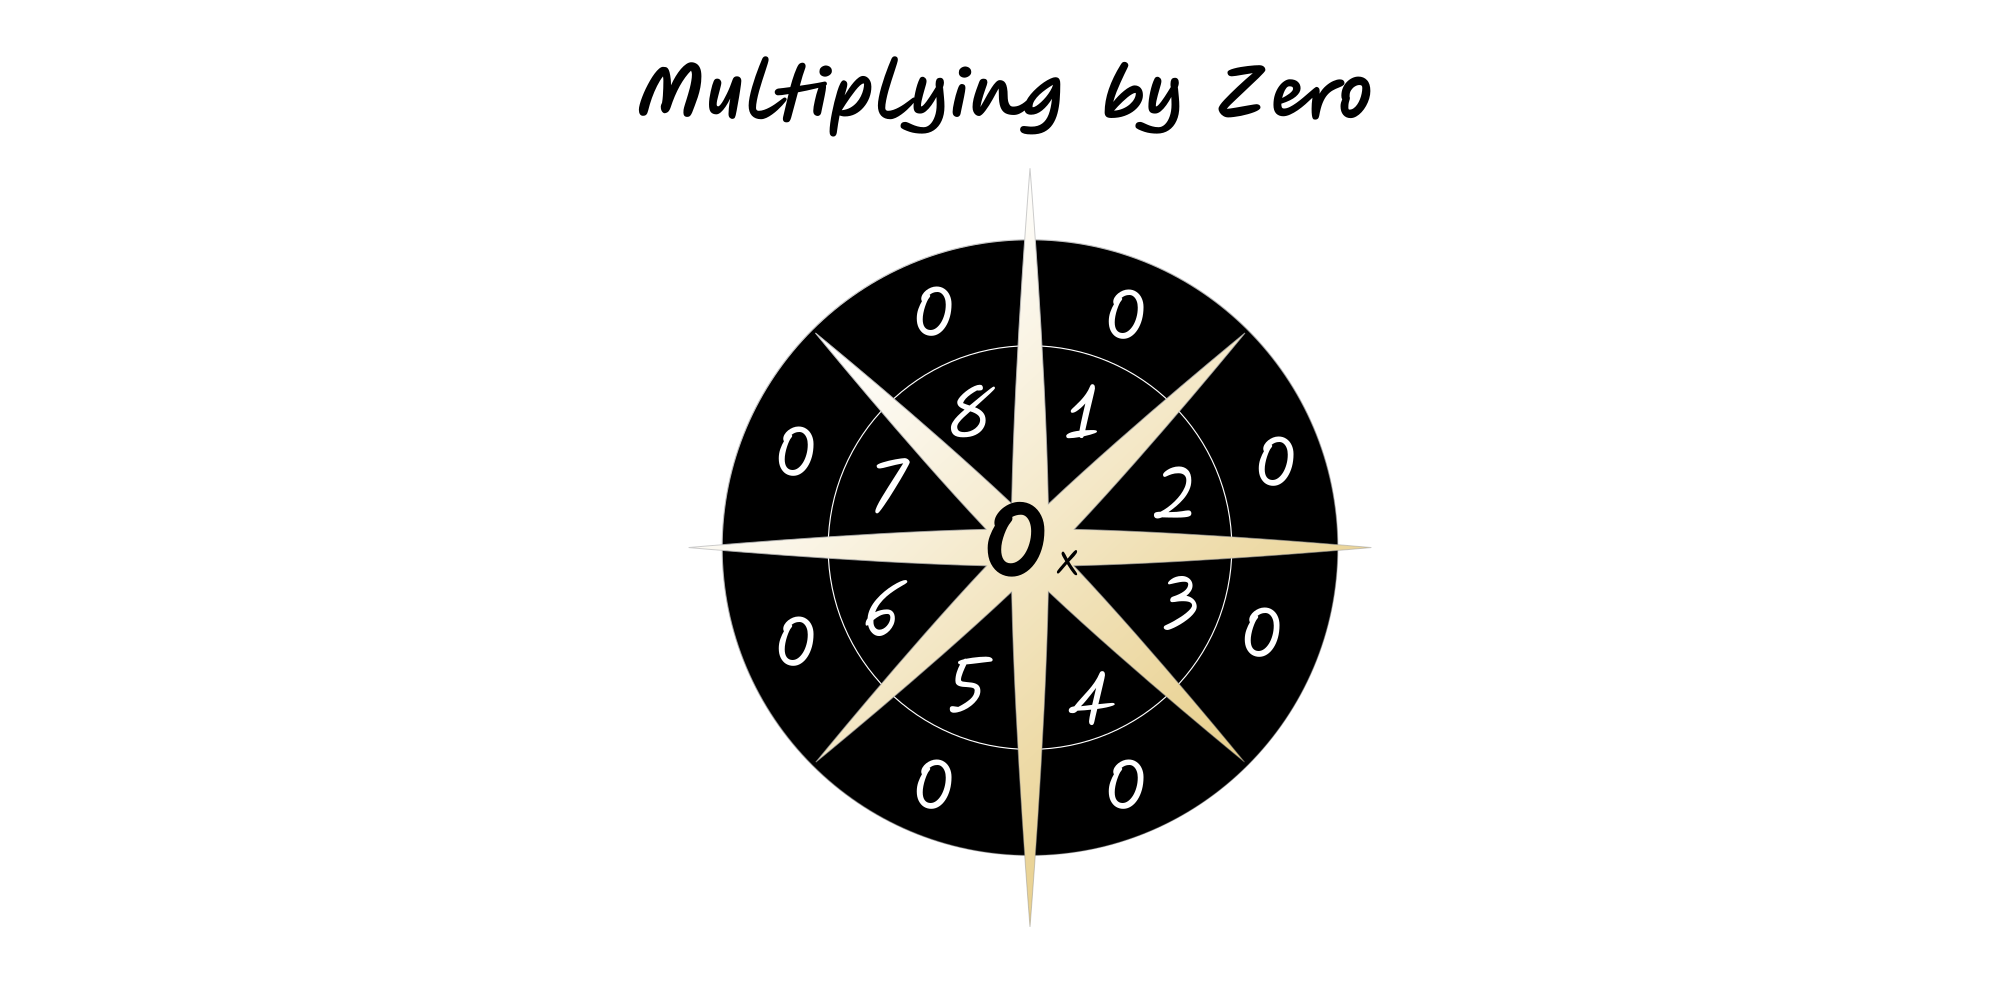
Multiplying by Zero
A single failure mode can zero the outcome (eg, safety, compliance).
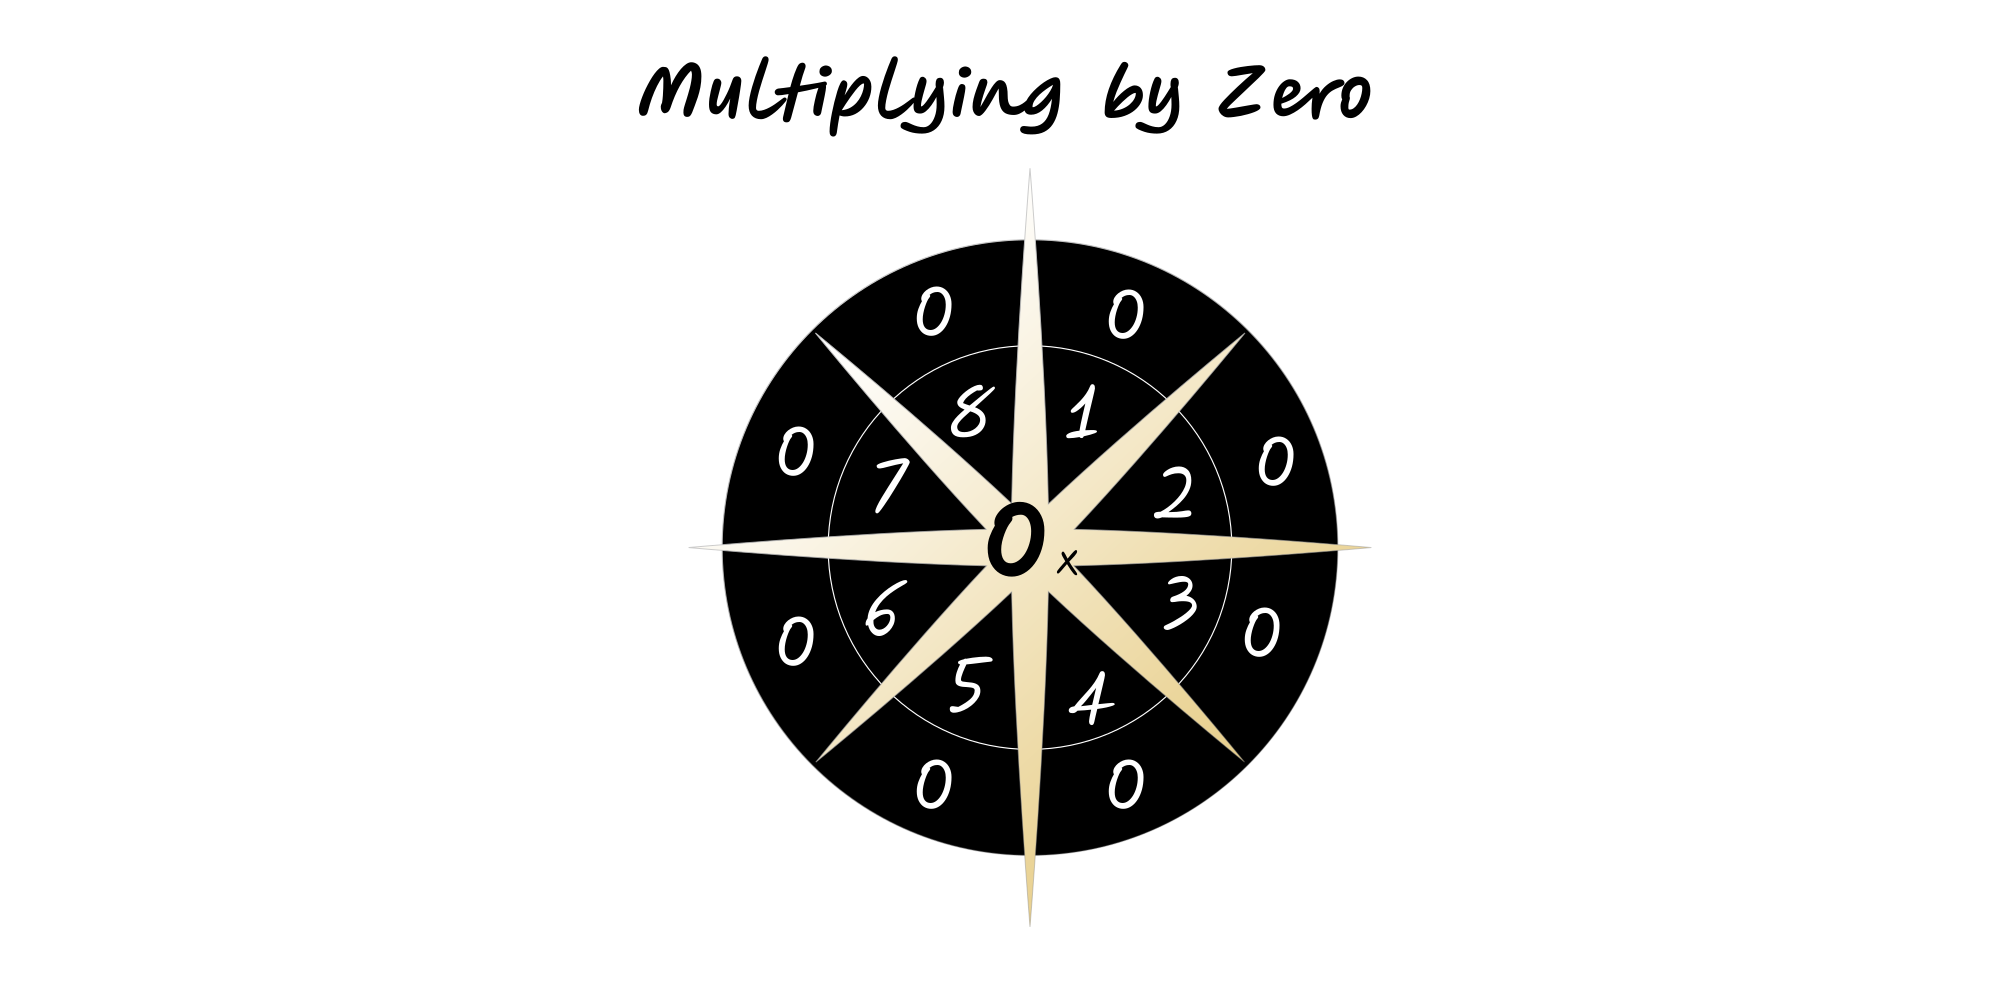
Multiplying by Zero
A single failure mode can zero the outcome (eg, safety, compliance).
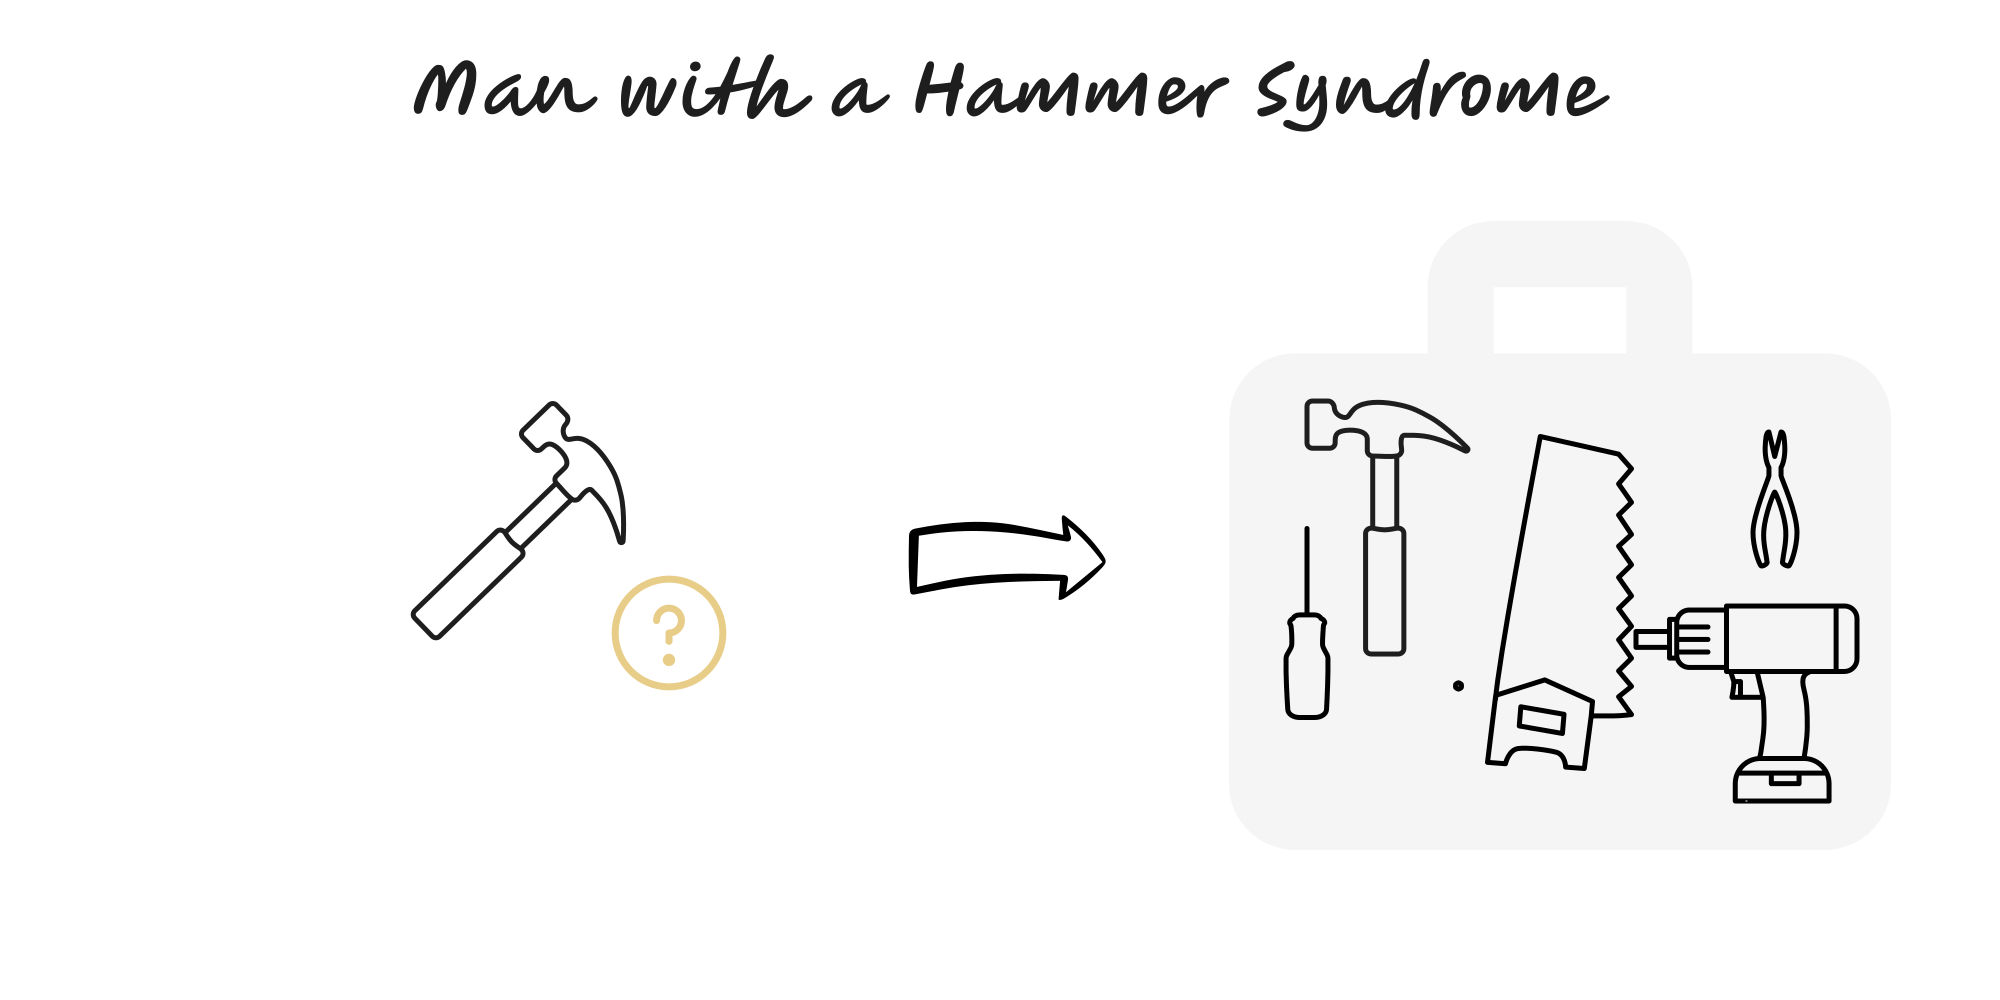
Man with a Hammer Syndrome
Over‑applying a favourite tool (“to a man with a hammer, everything looks like a nail”).
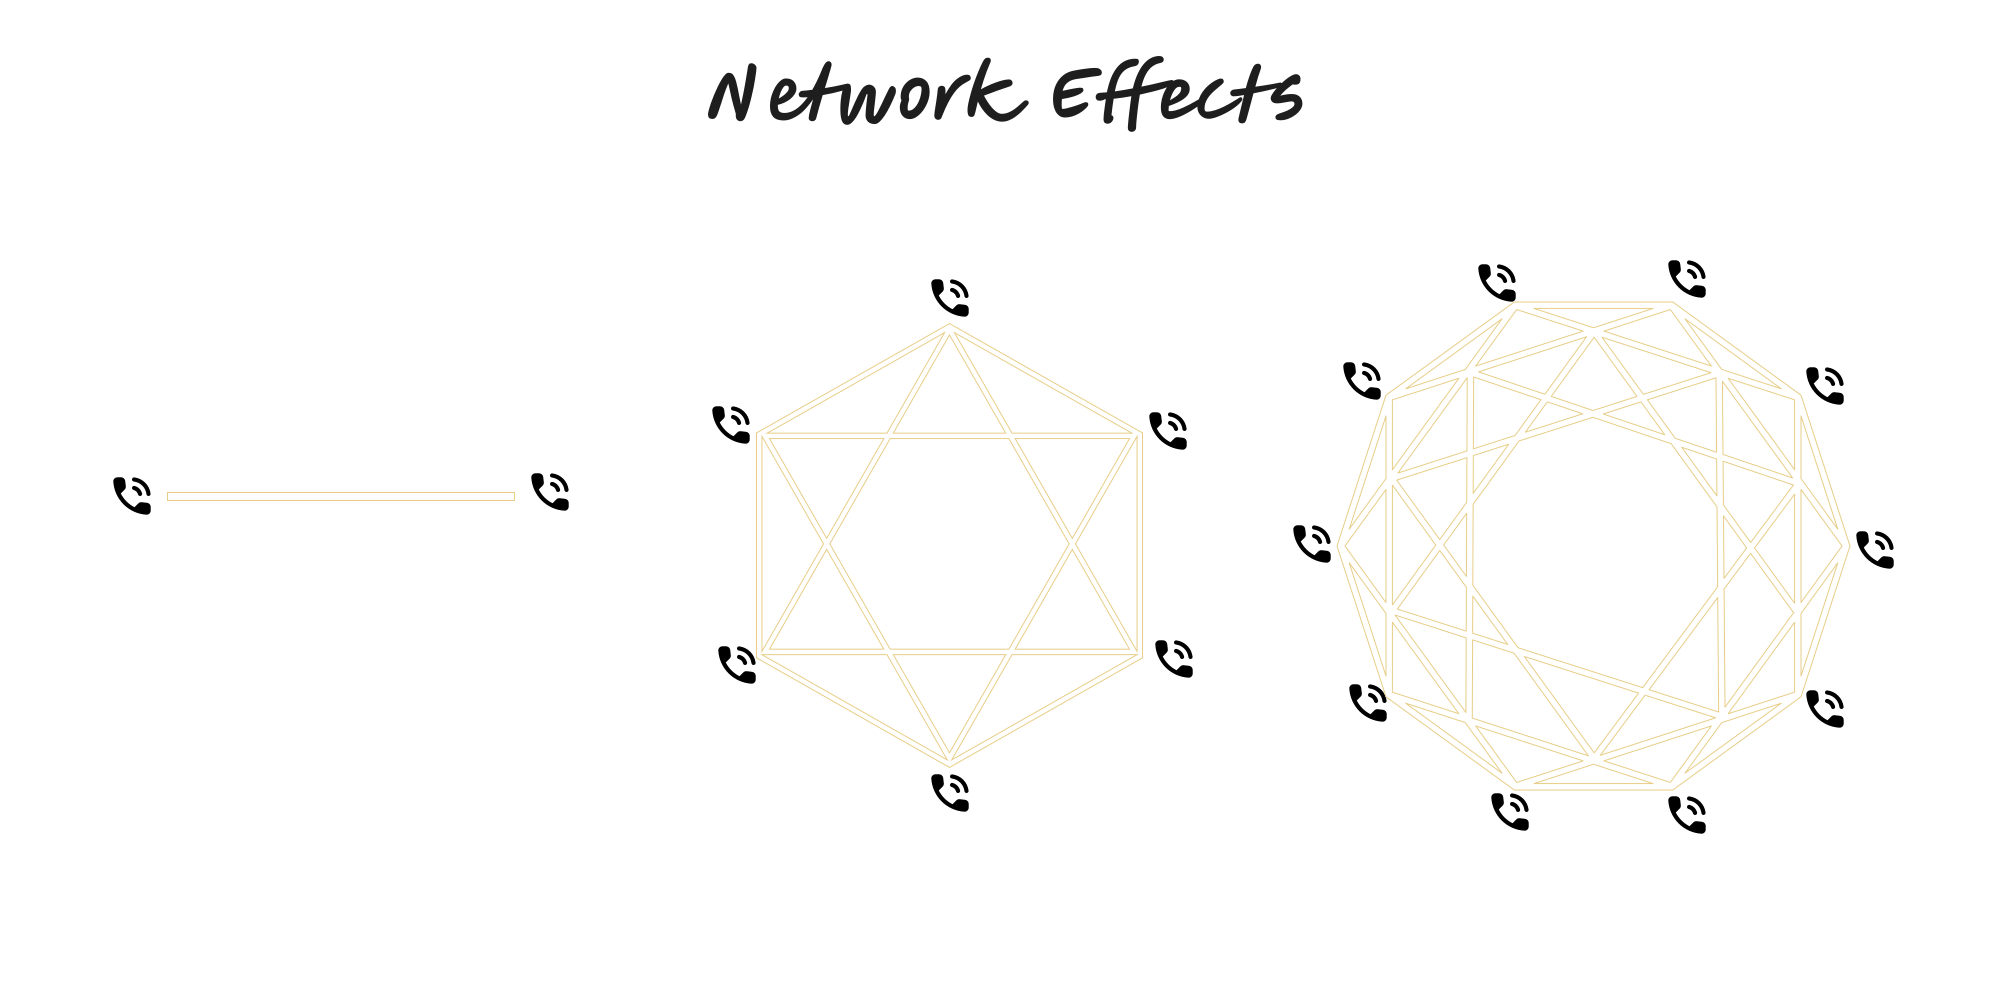
Network Effects
A product becomes more valuable as more participants join and interact. Design for liquidity and quality, not just user count.
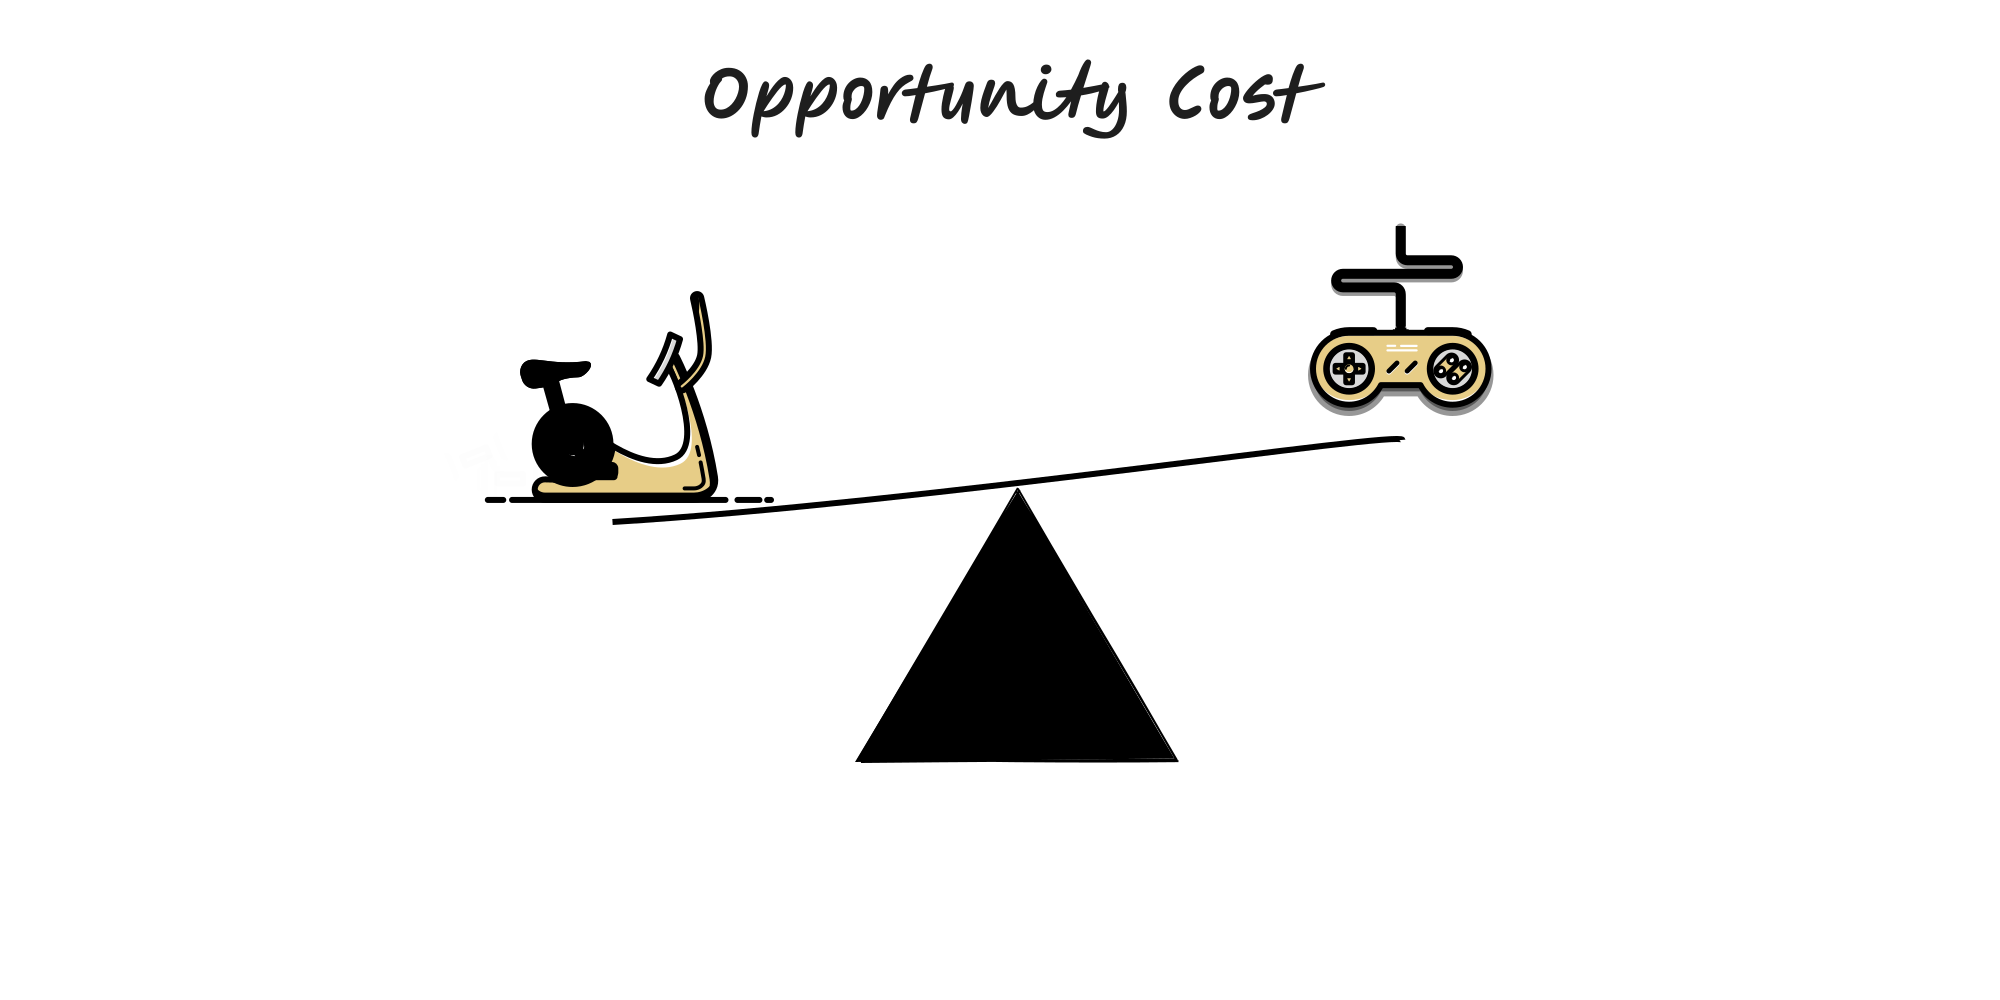
Opportunity Cost
The real cost of any choice is the next-best alternative you give up.
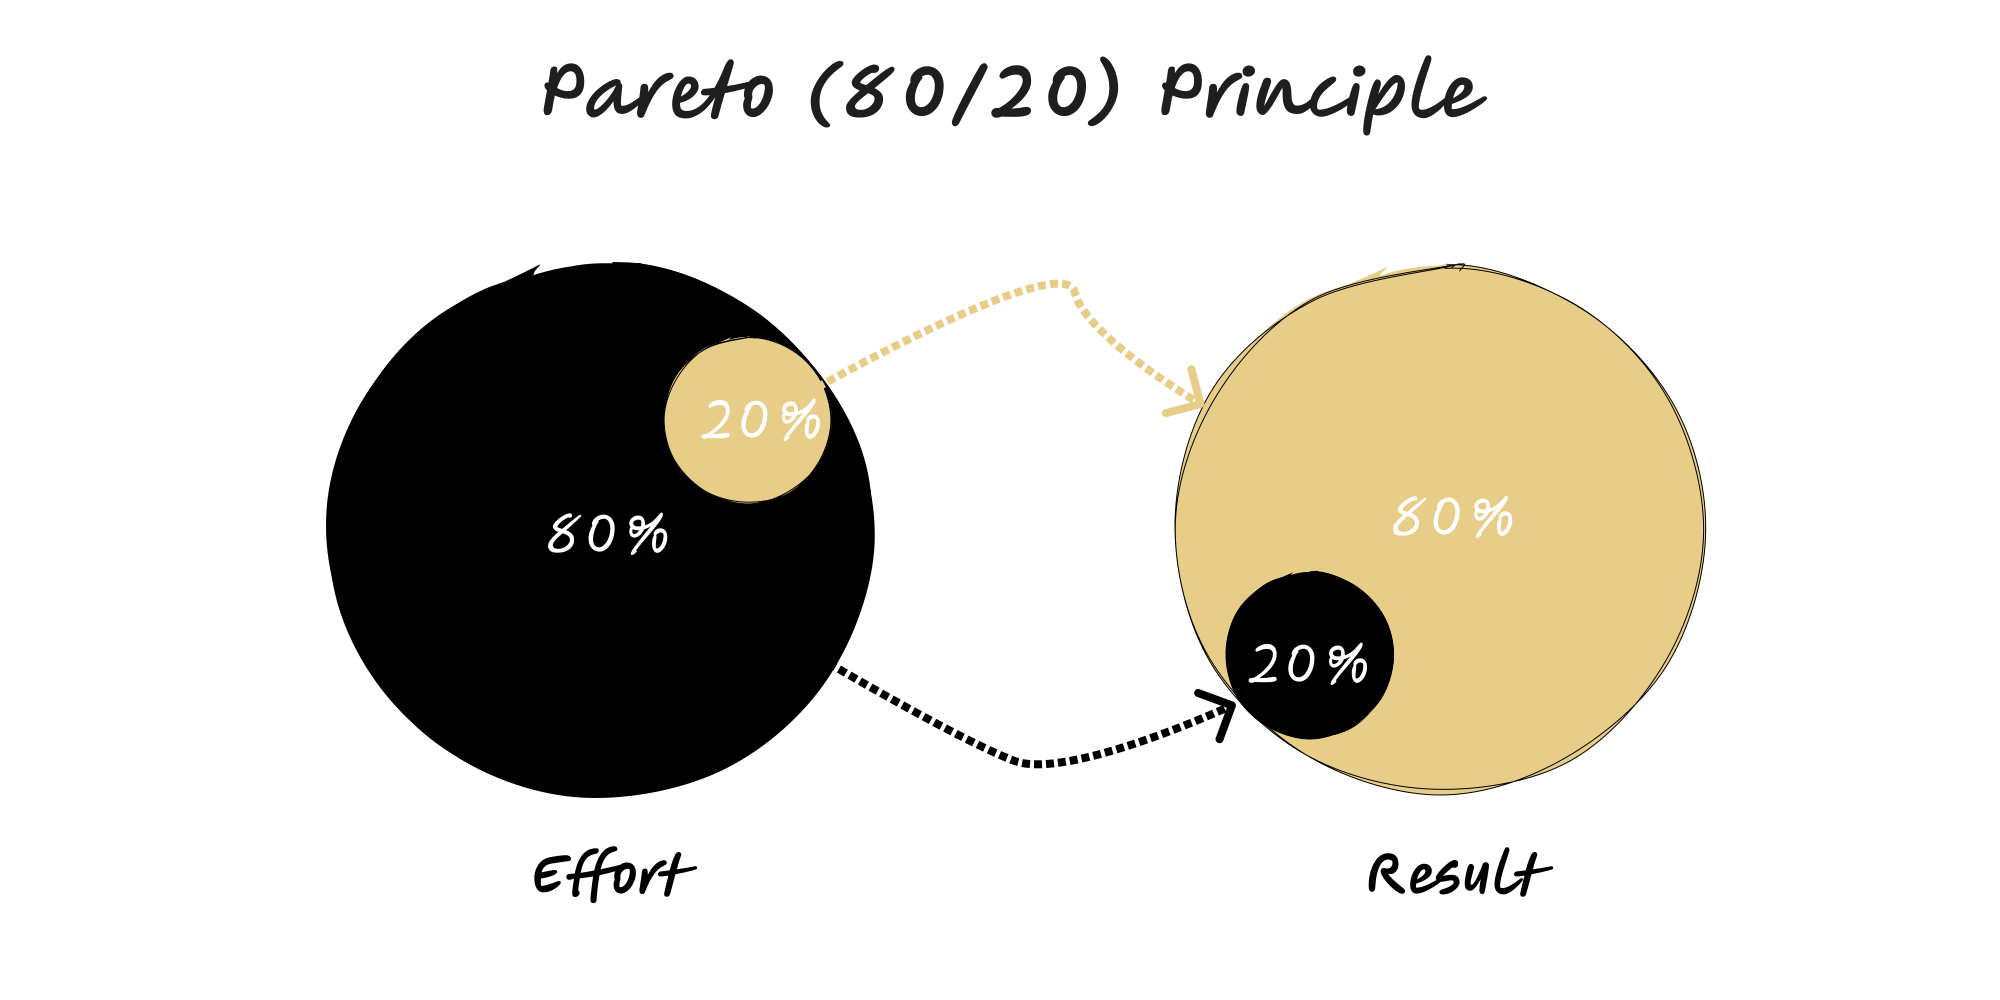
Pareto Principle (80/20)
A minority of inputs often drives a majority of outcomes. Find the vital few, focus there first.
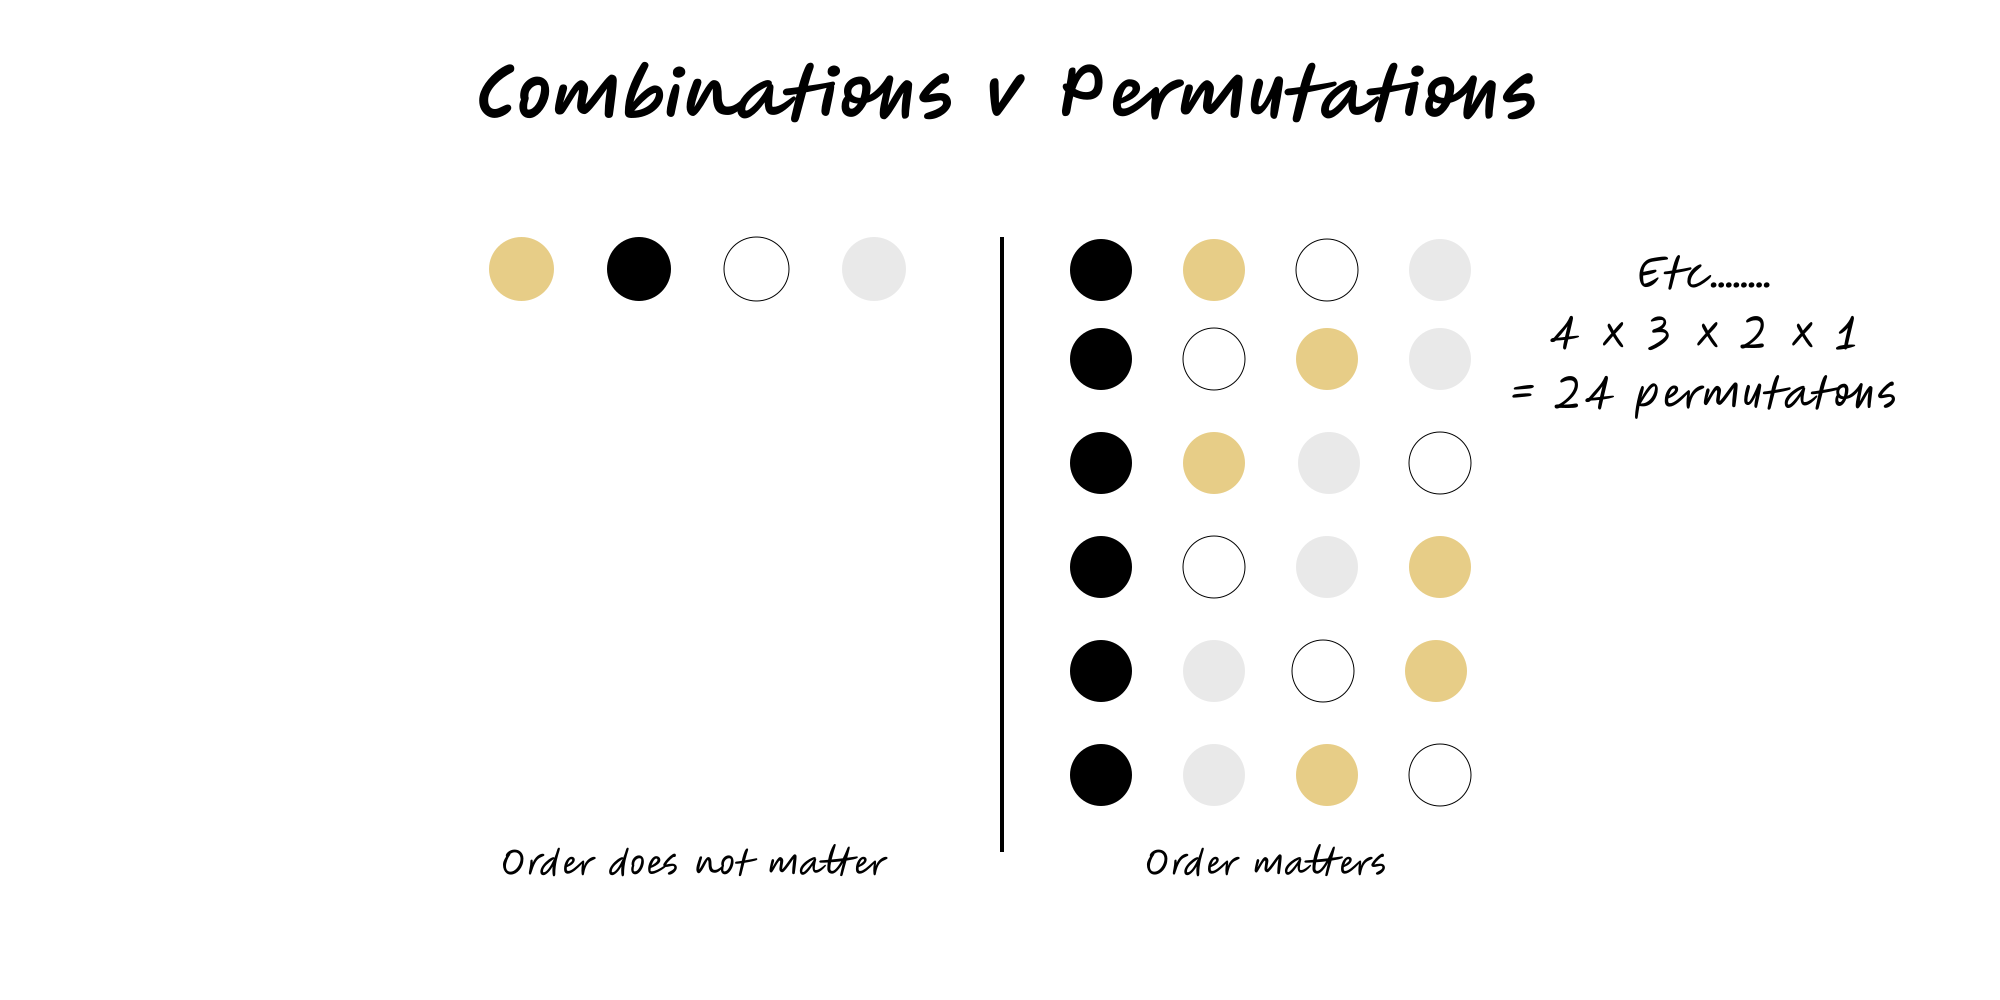
Combinations vs Permutations
Order matters → permutations. Order doesn’t → combinations. Adjust for with/without replacement.
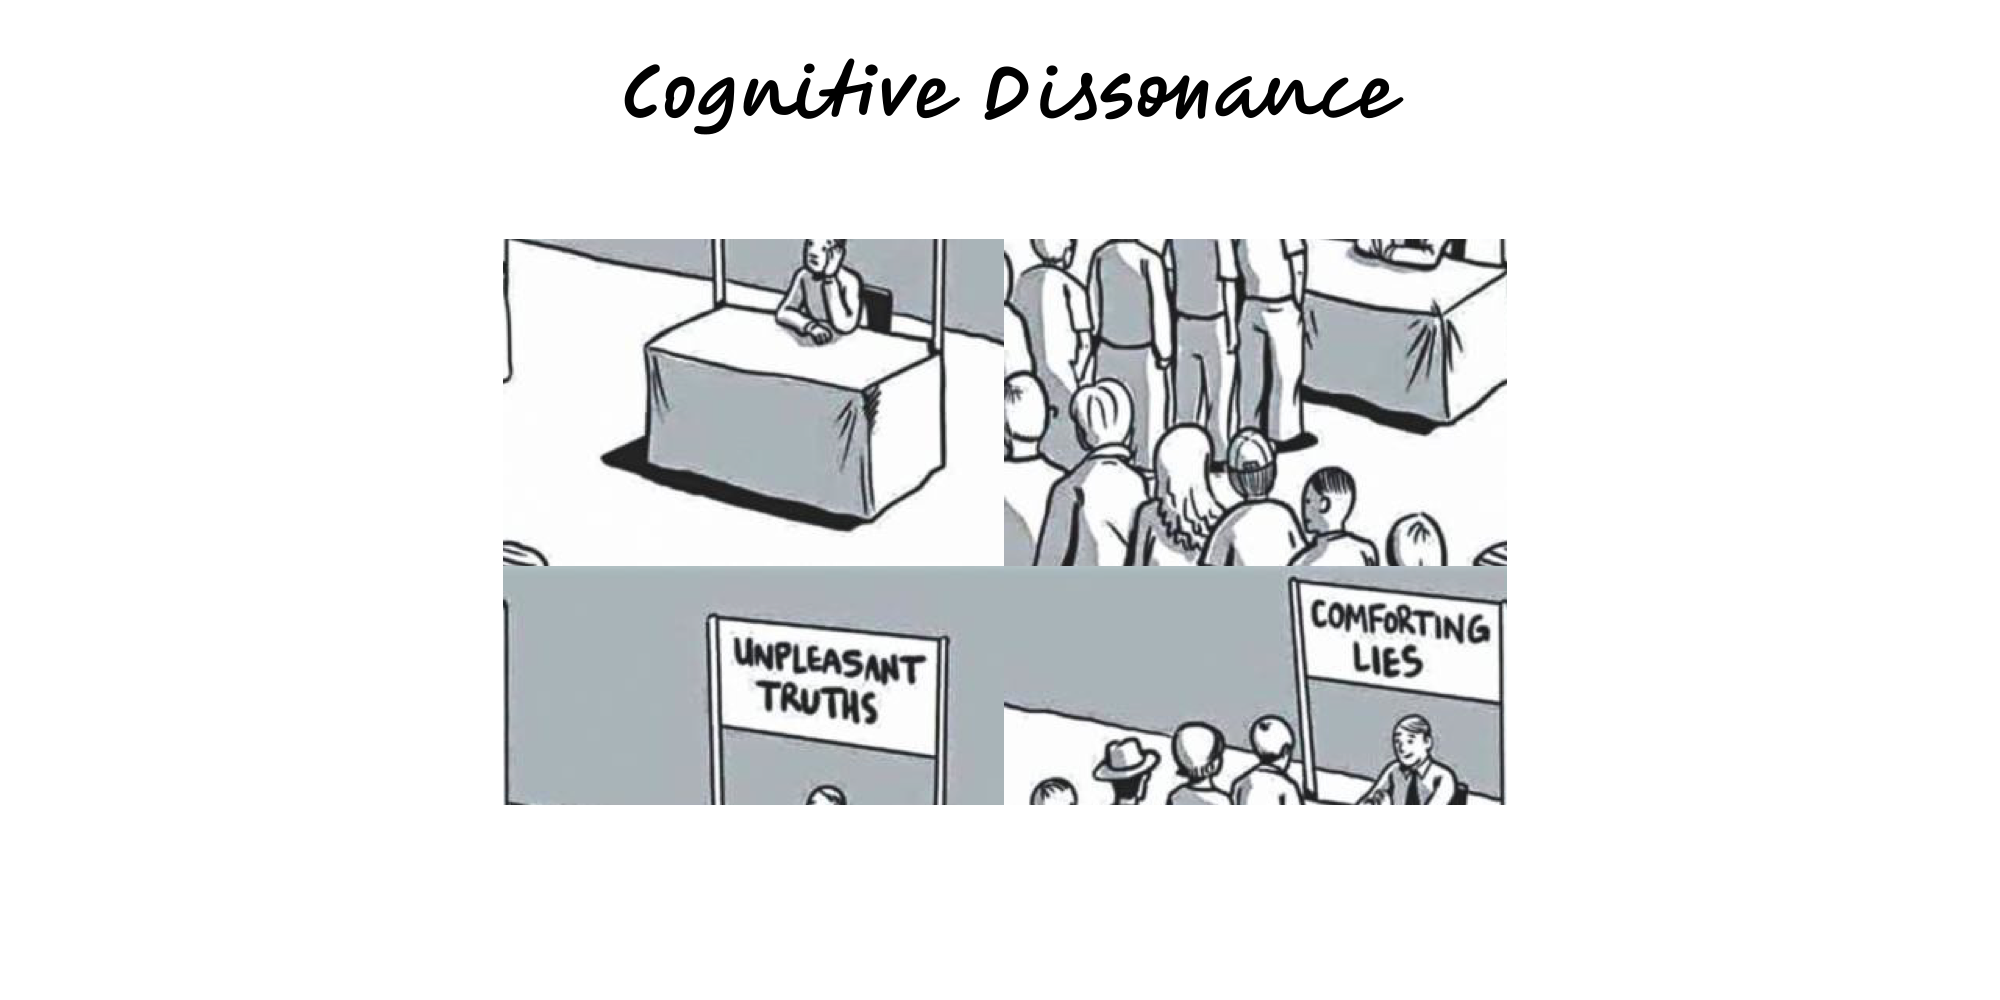
Cognitive Dissonance
Festinger’s insight: when beliefs and actions clash, we rationalise.
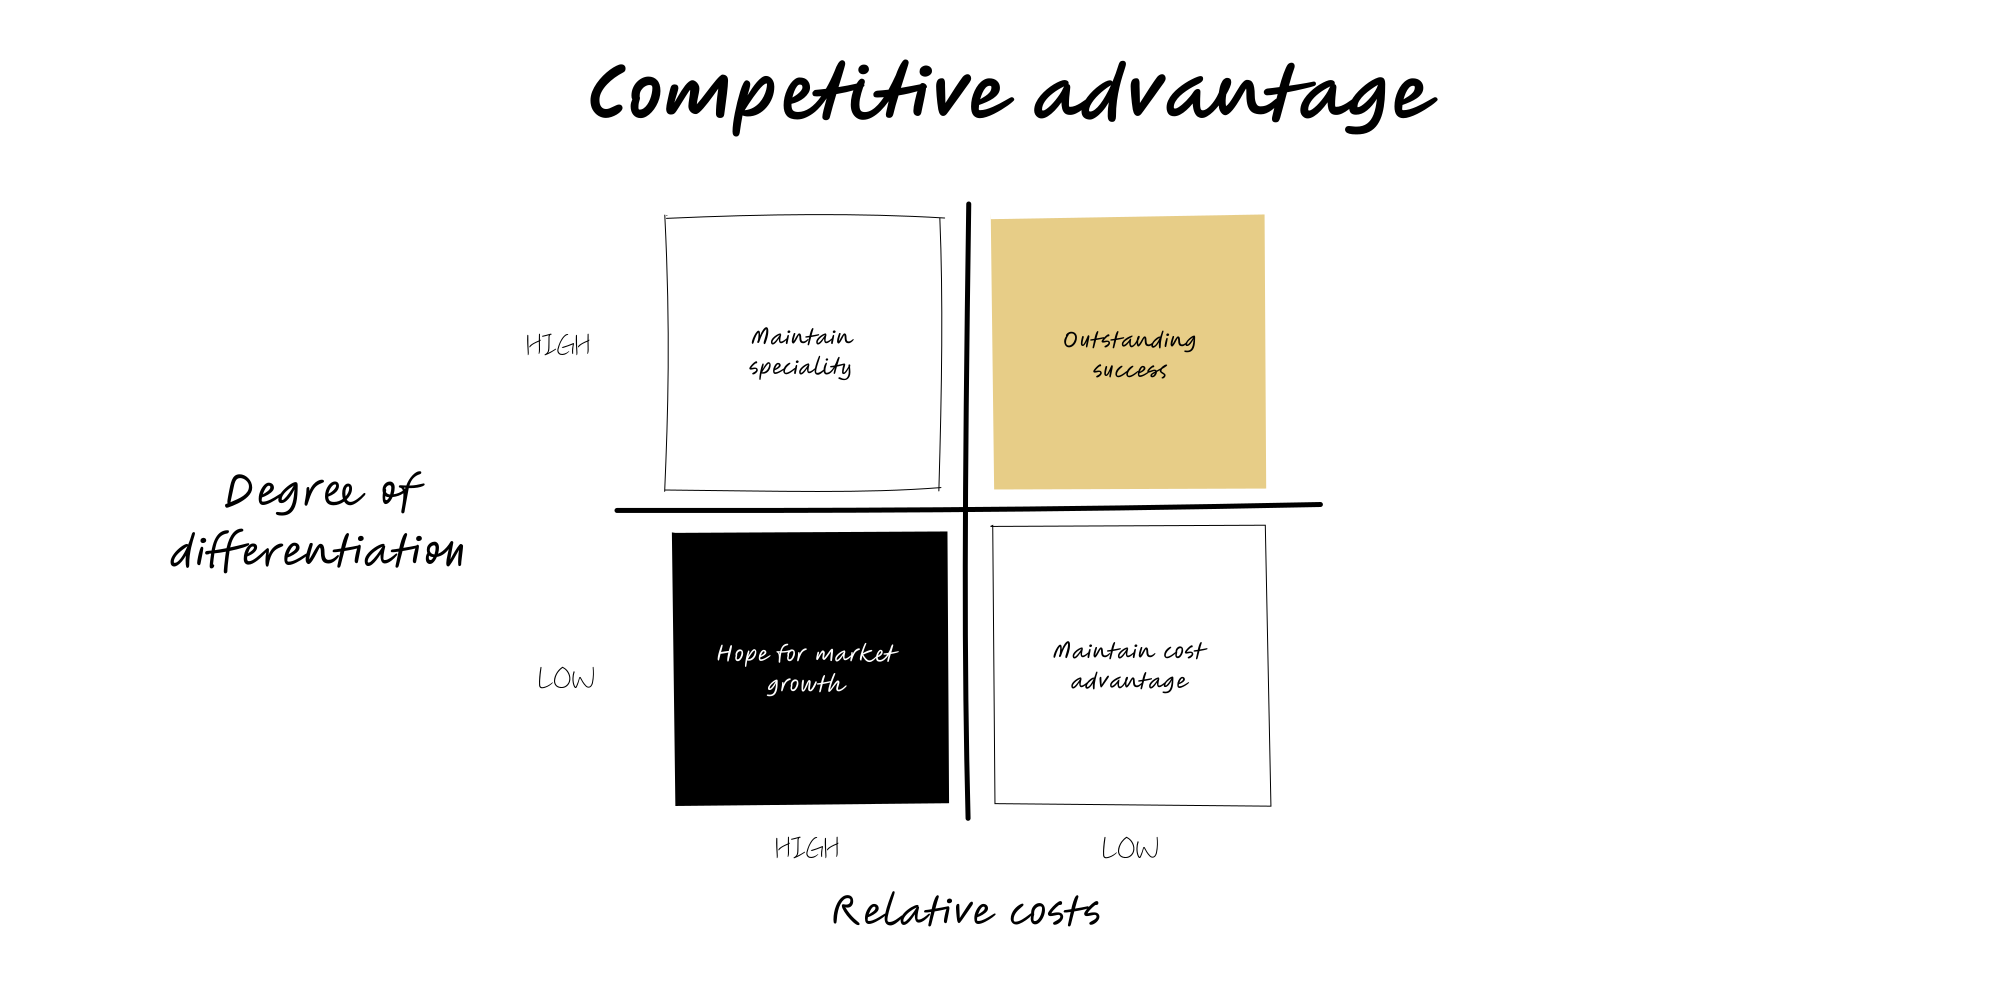
Competitive Advantage
A durable edge that lets you create more value or deliver it at lower cost than rivals — and keep it via isolating mechanisms.
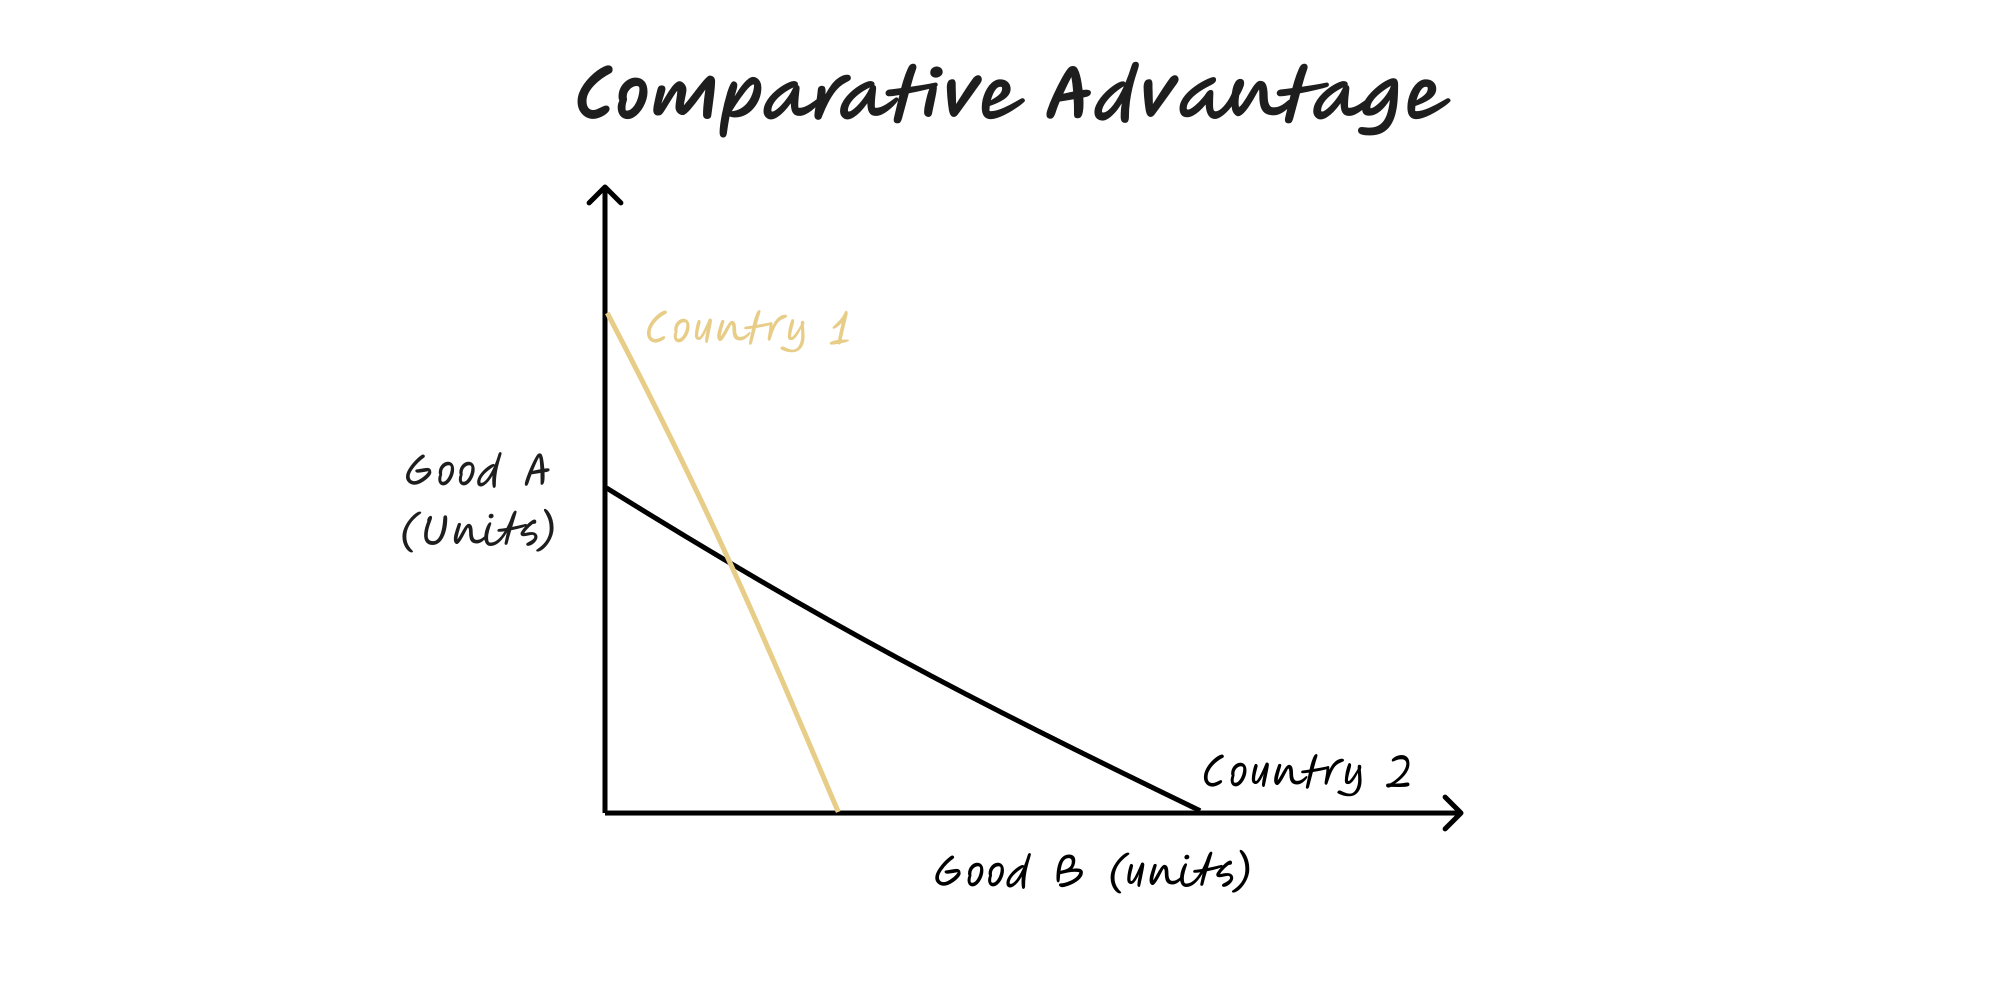
Comparative Advantage
Specialise in what you produce at lower opportunity cost and trade the rest.
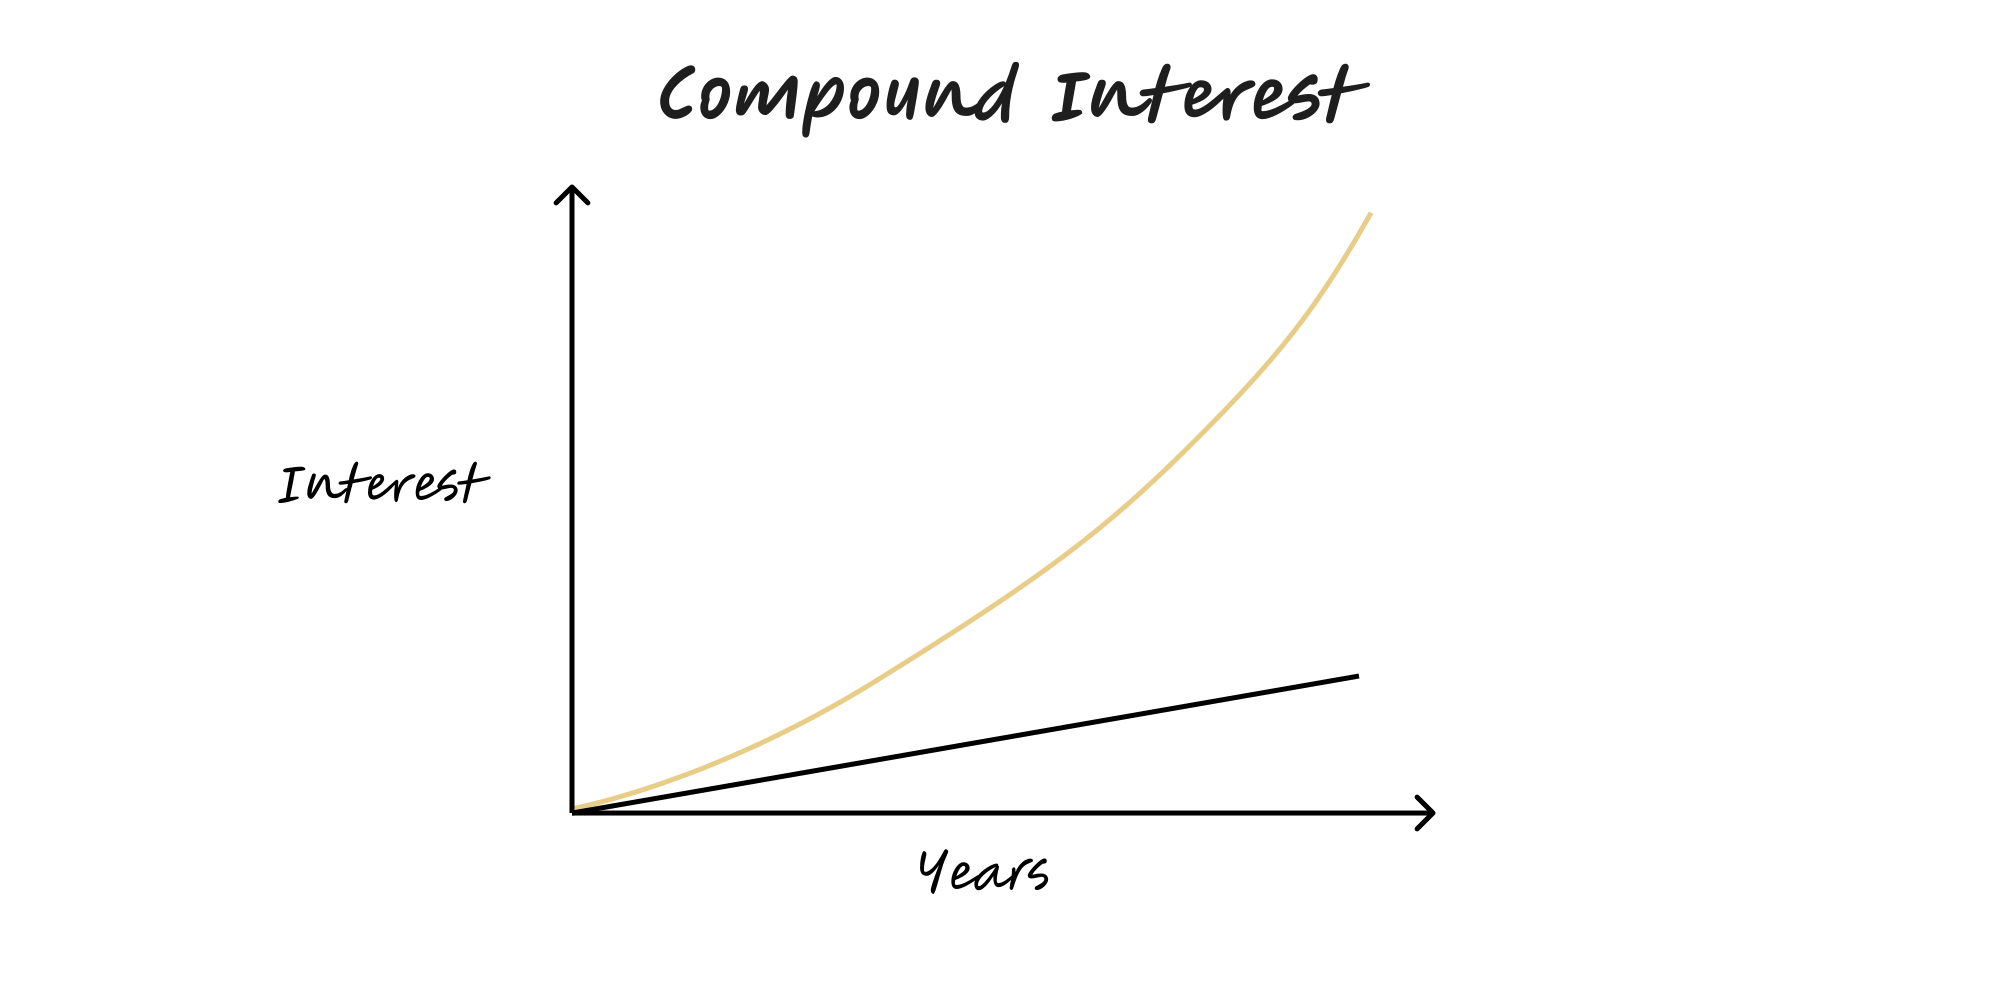
Compound Interest
Compound Interest is a practical lens to frame decisions and reduce error.
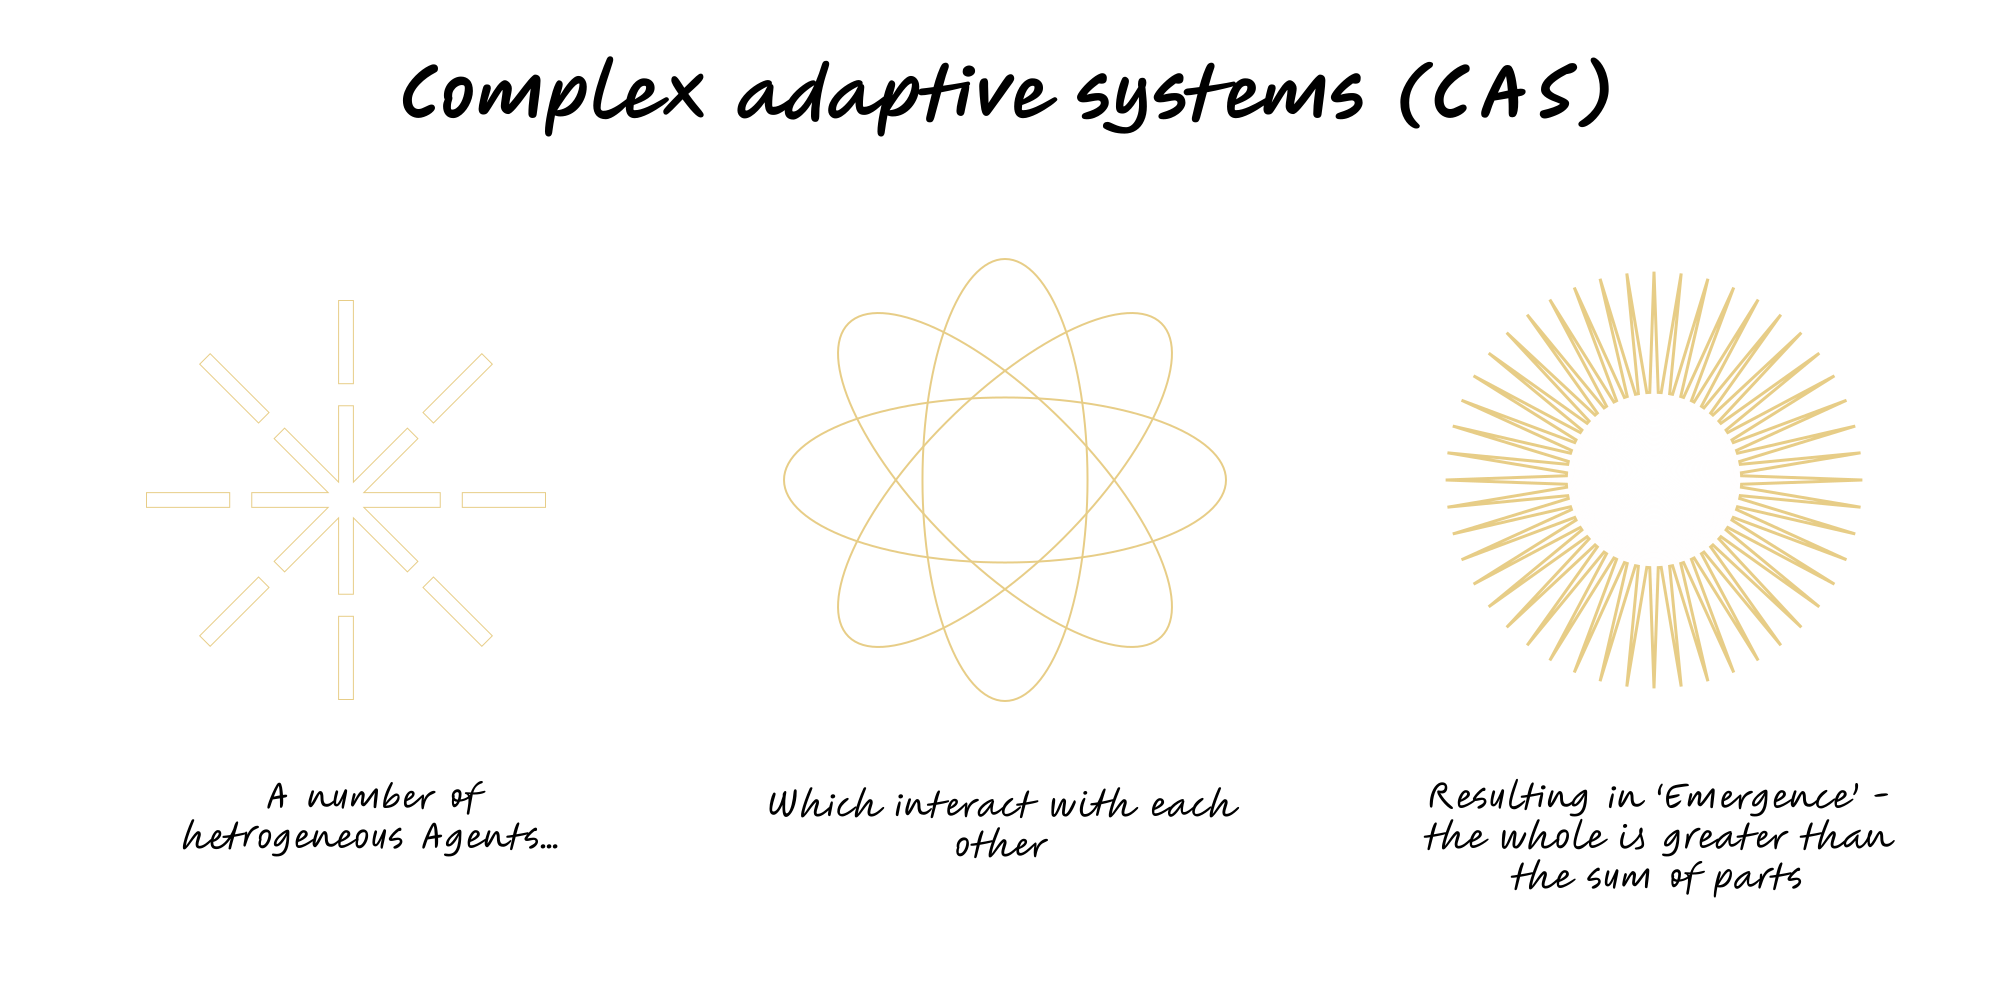
Complex Adaptive Systems
Many interacting agents following simple rules create emergent behaviour.
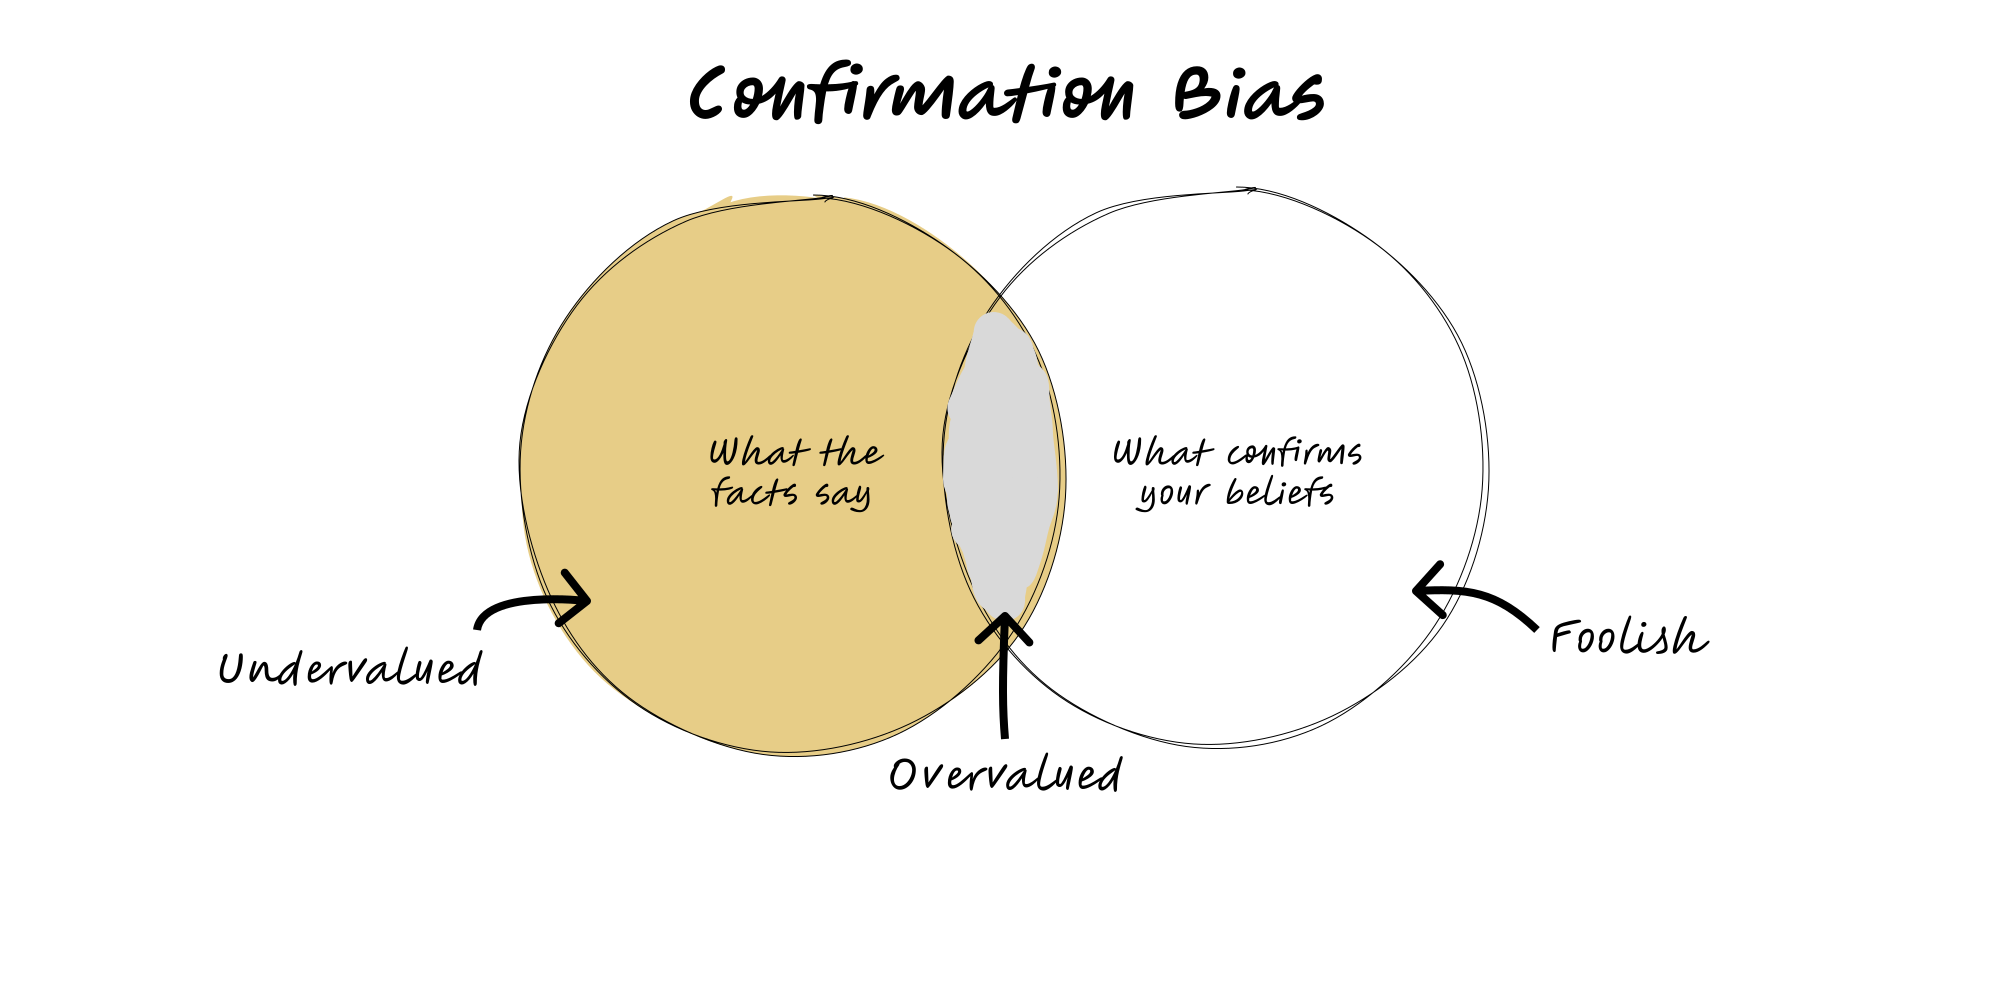
Confirmation Bias
Confirmation Bias is a practical lens to frame decisions and reduce error.
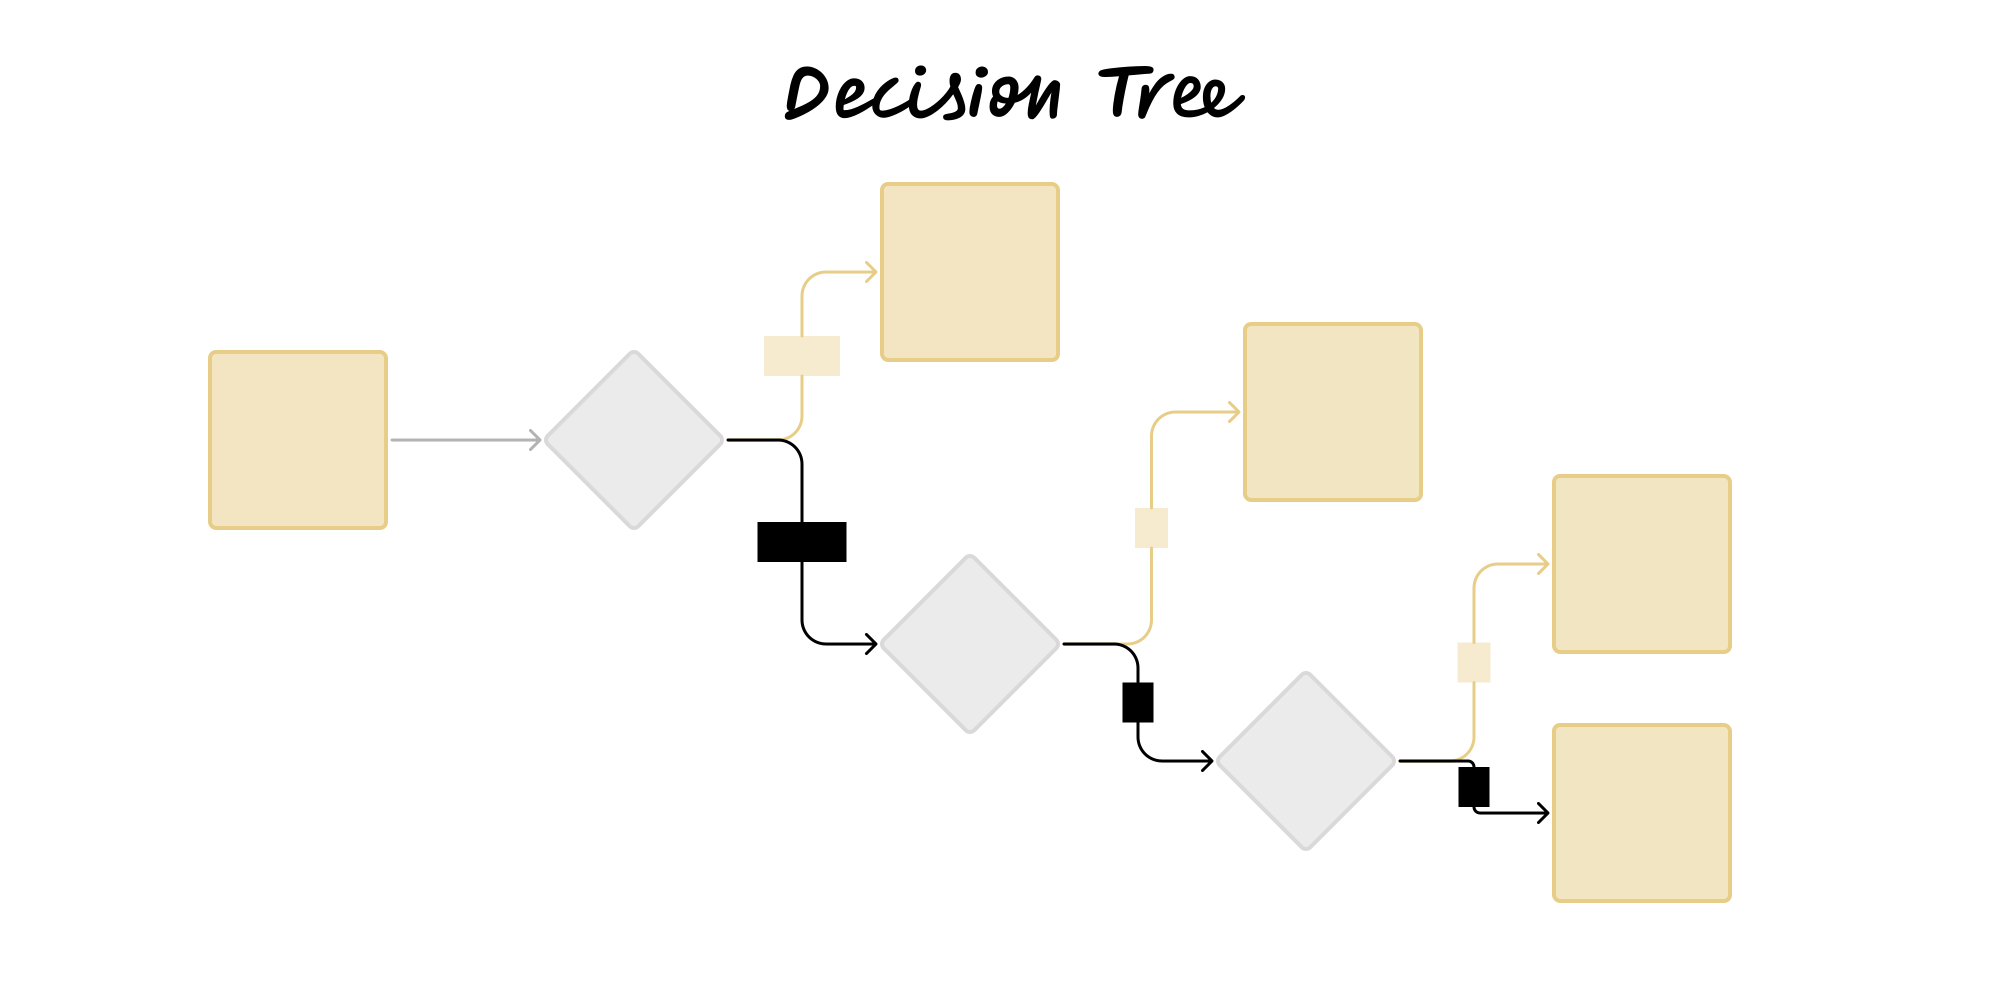
Decision Tree
A visual of sequential decisions with probabilities and payoffs; fold back to compute expected value.
Eisenhower Matrix
Prioritise by importance, not urgency: Do, Schedule, Delegate, or Eliminate.
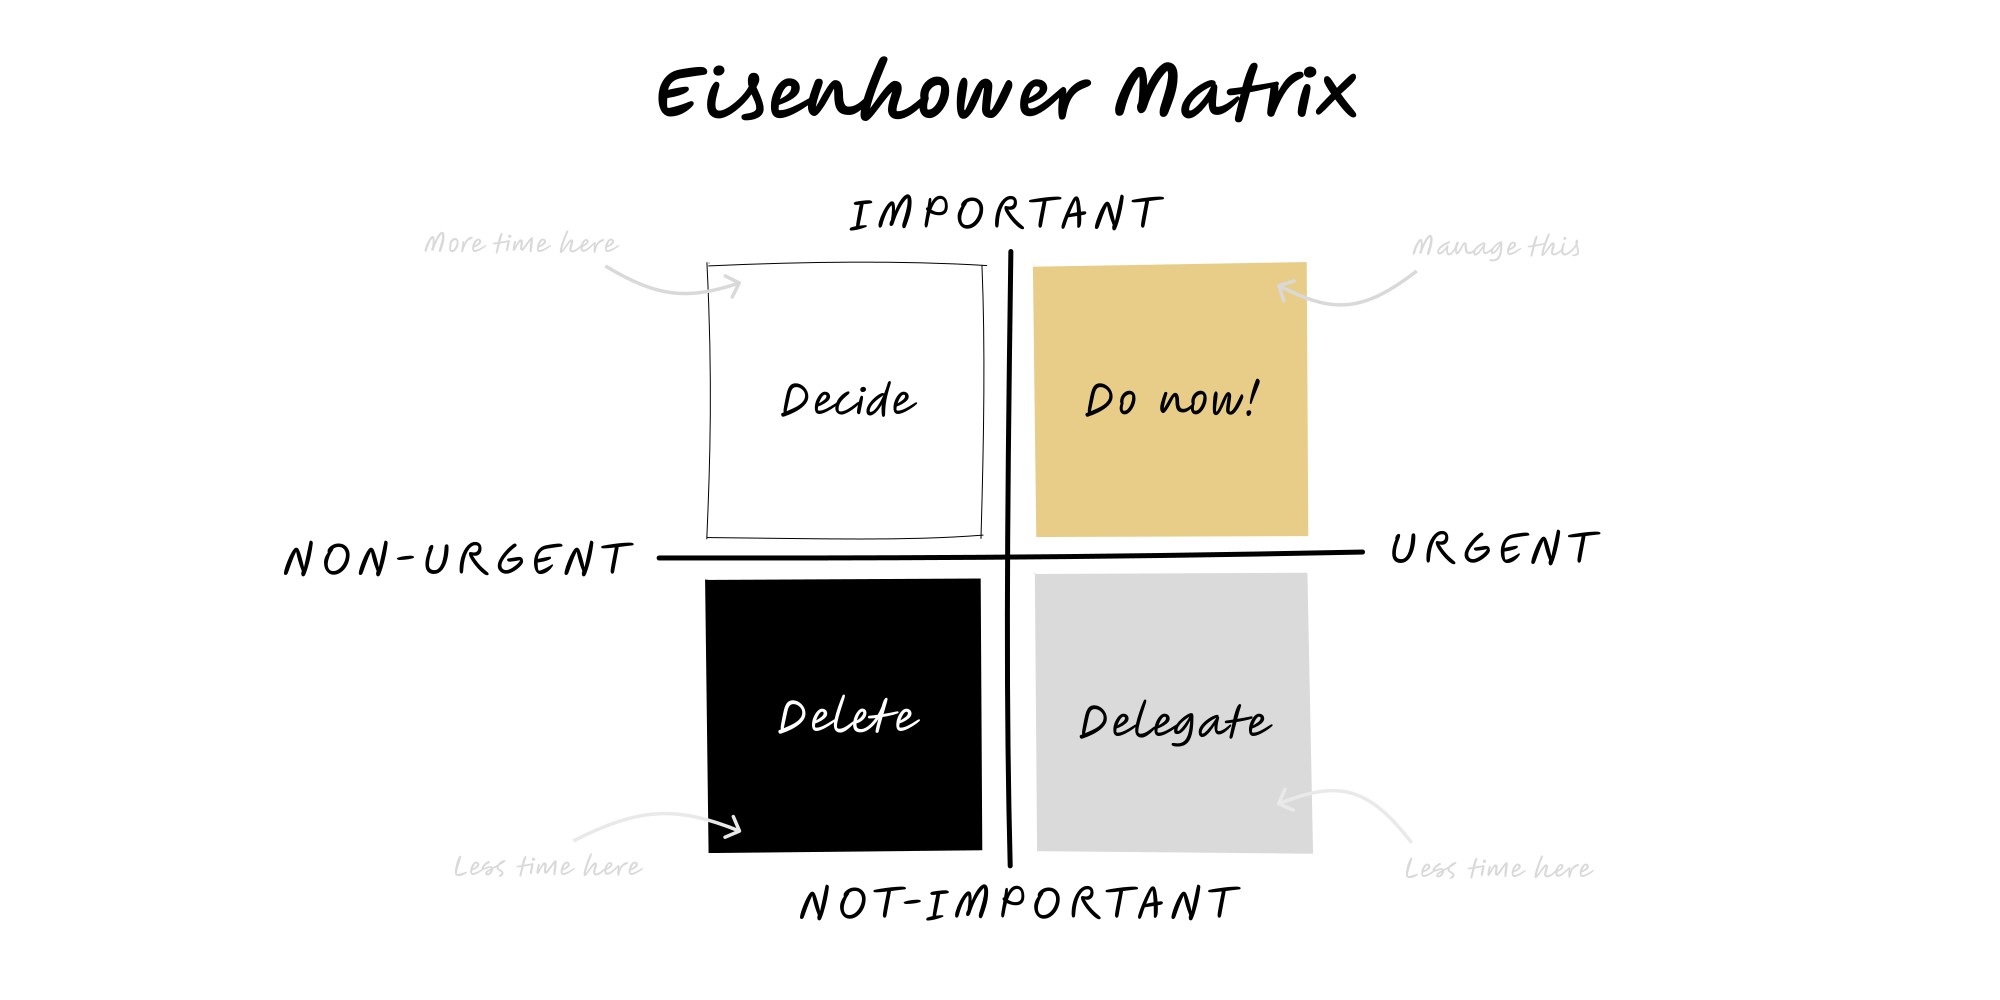
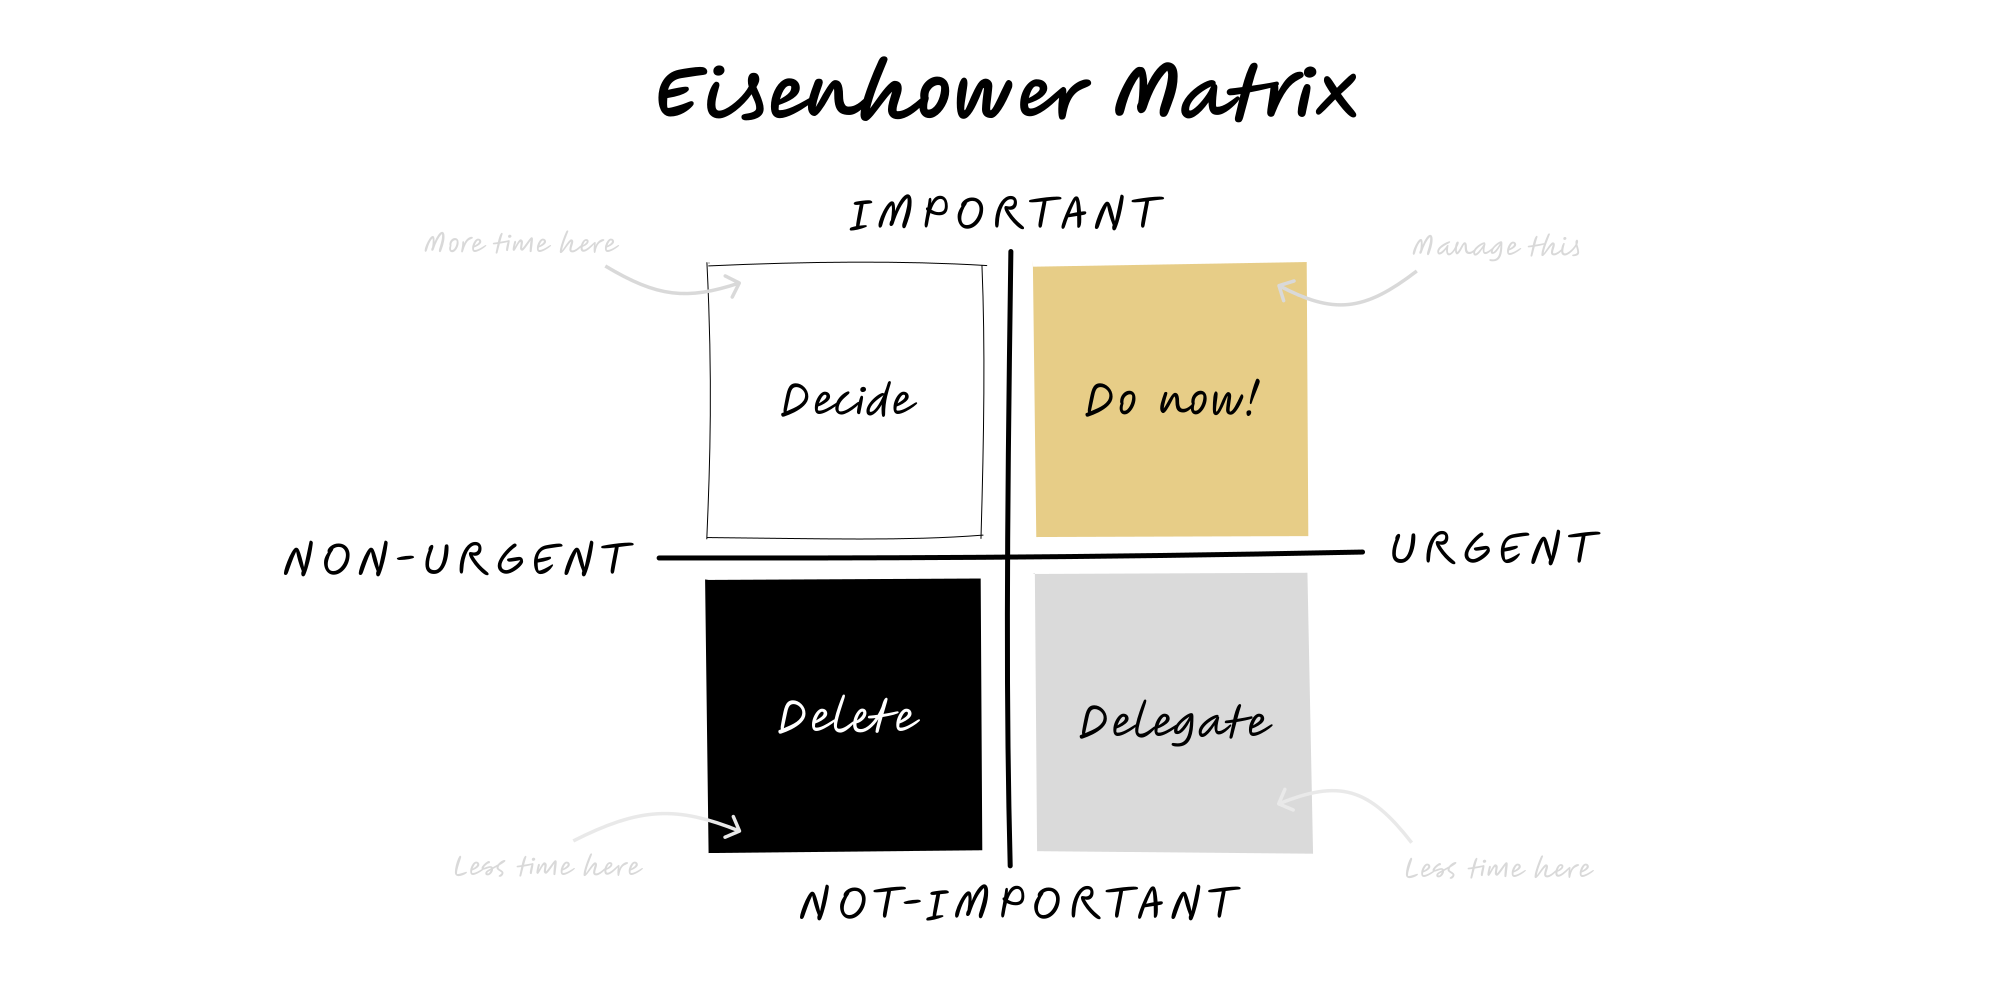
Eisenhower Matrix
Prioritise by importance, not urgency: Do, Schedule, Delegate, or Eliminate.
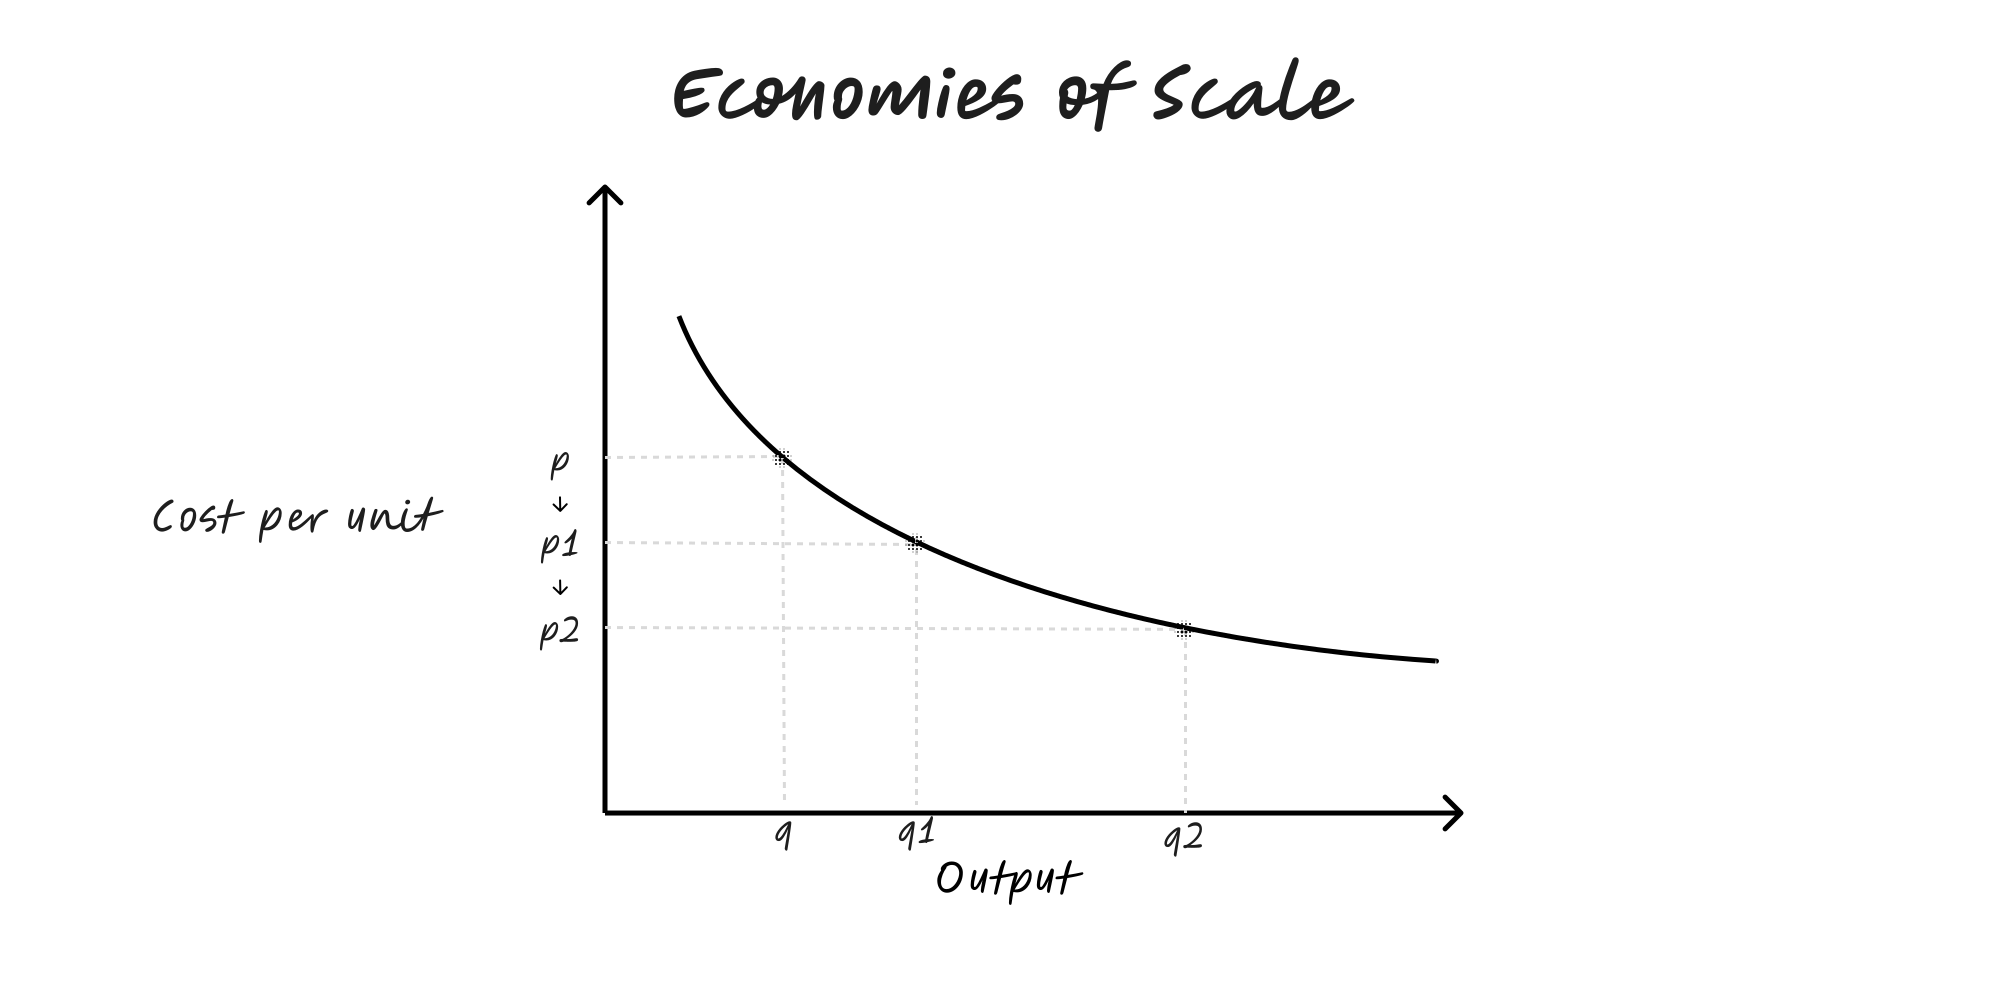
Economies of Scale
Produce more to lower average cost by spreading fixed costs, improving specialisation and buying better—until coordination costs bite.
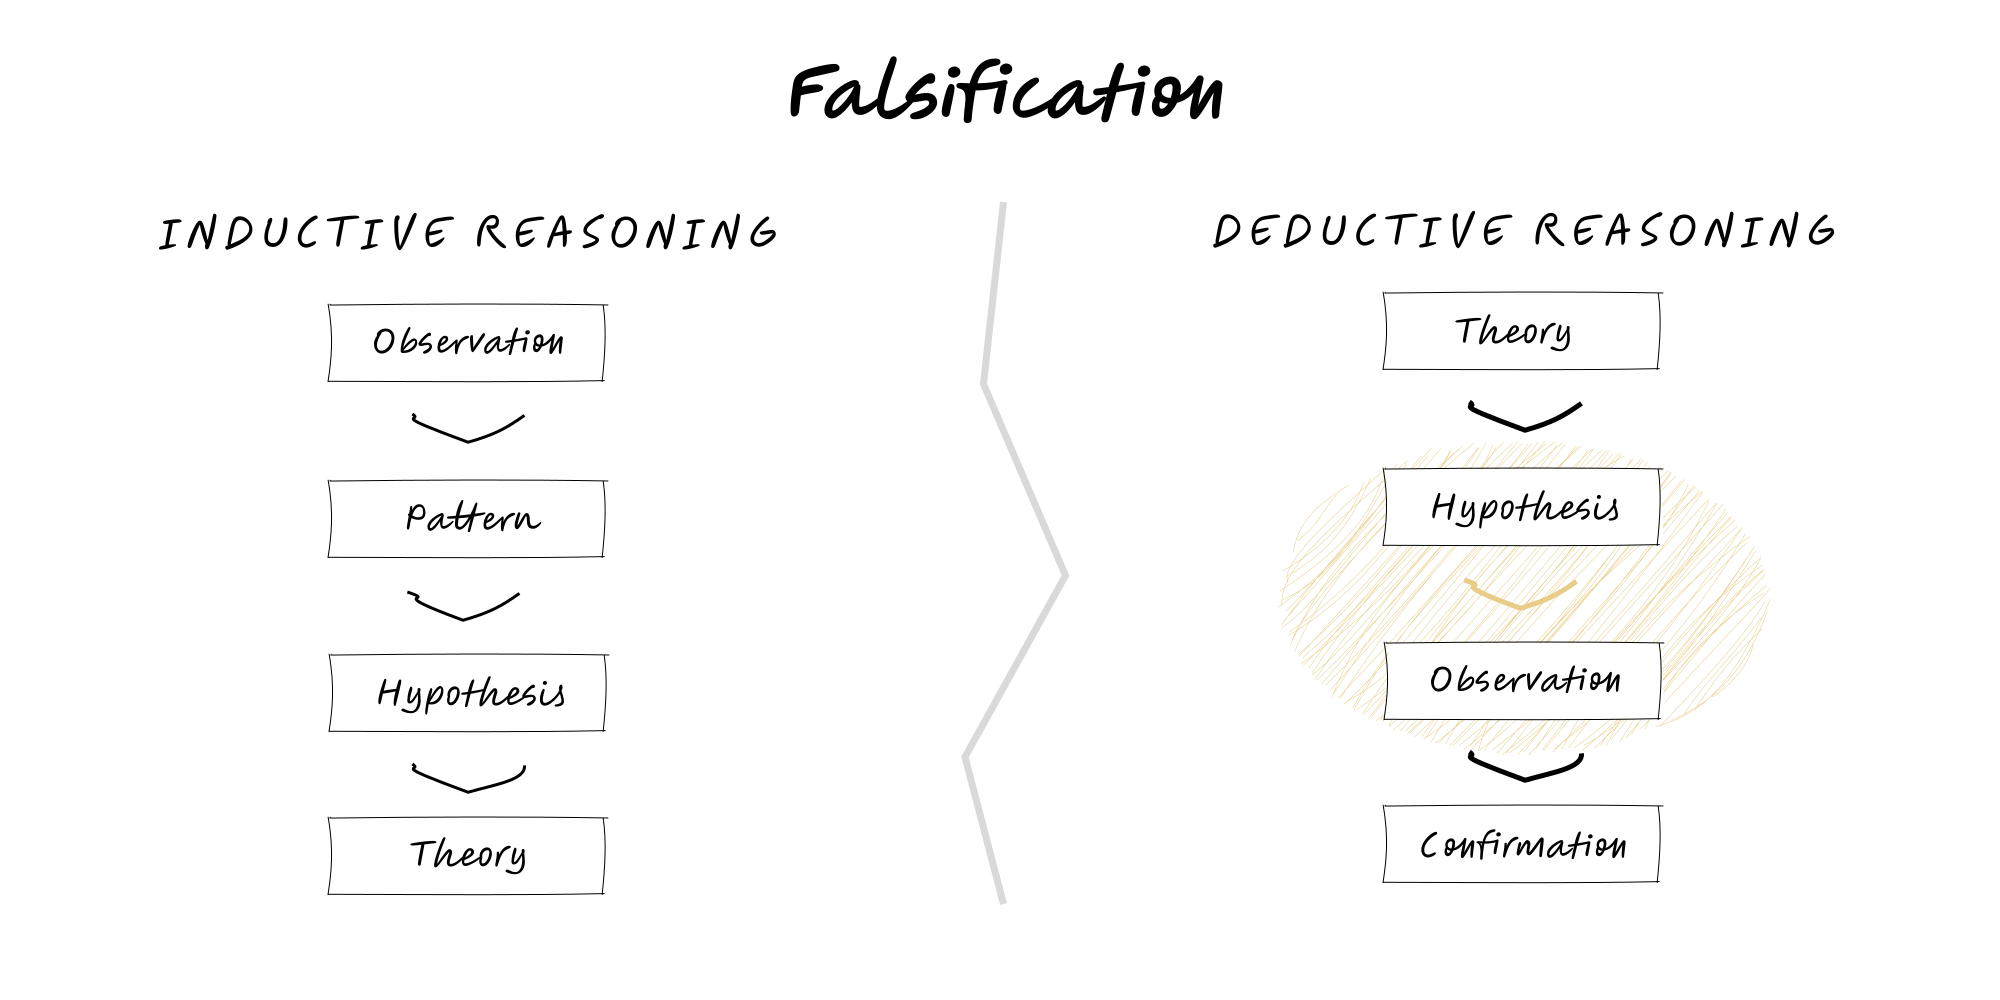
Falsification
Popper’s rule: scientific theories must be testable and killable by evidence.
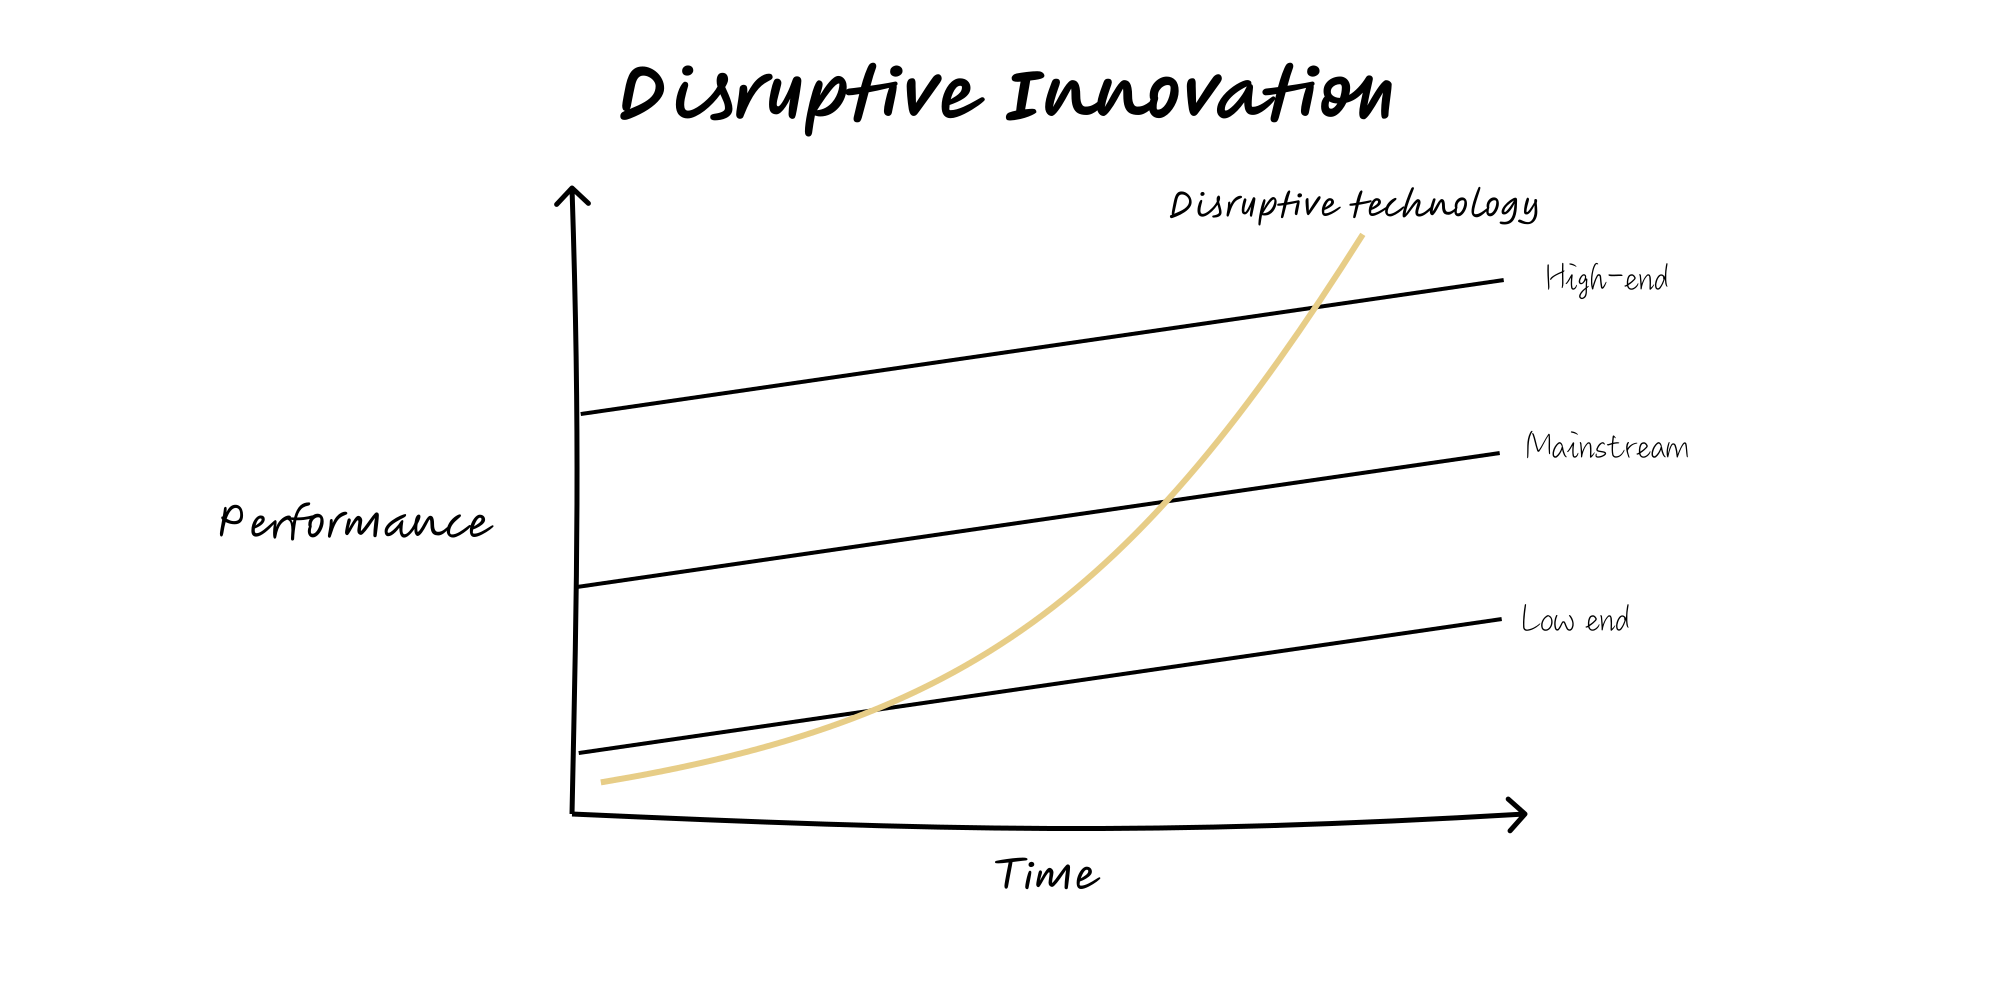
Disruptive Innovation
Entrants start with cheaper, simpler offers for over-served or non-consumers, then move upmarket while incumbents ignore them.
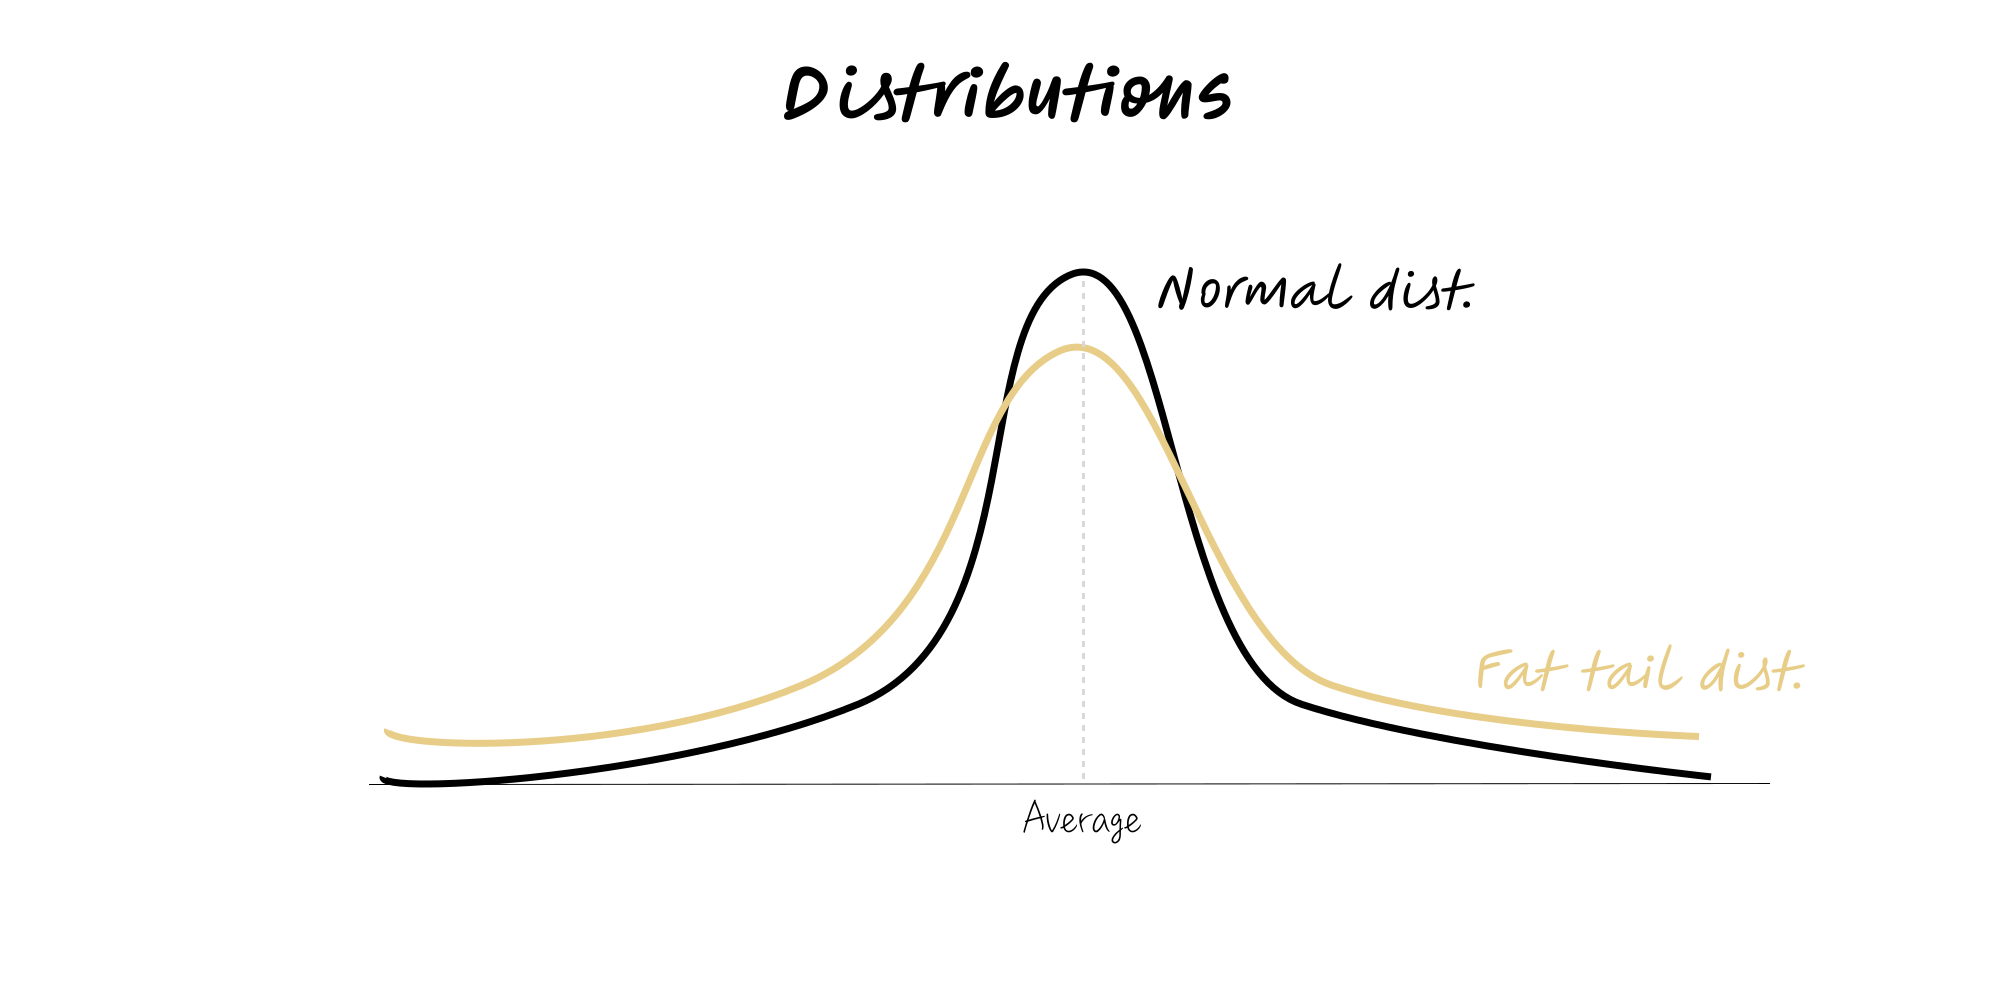
Distributions
Outcomes don’t all follow the normal curve. Know the shape and tails of your data and choose metrics, forecasts and safeguards to match.
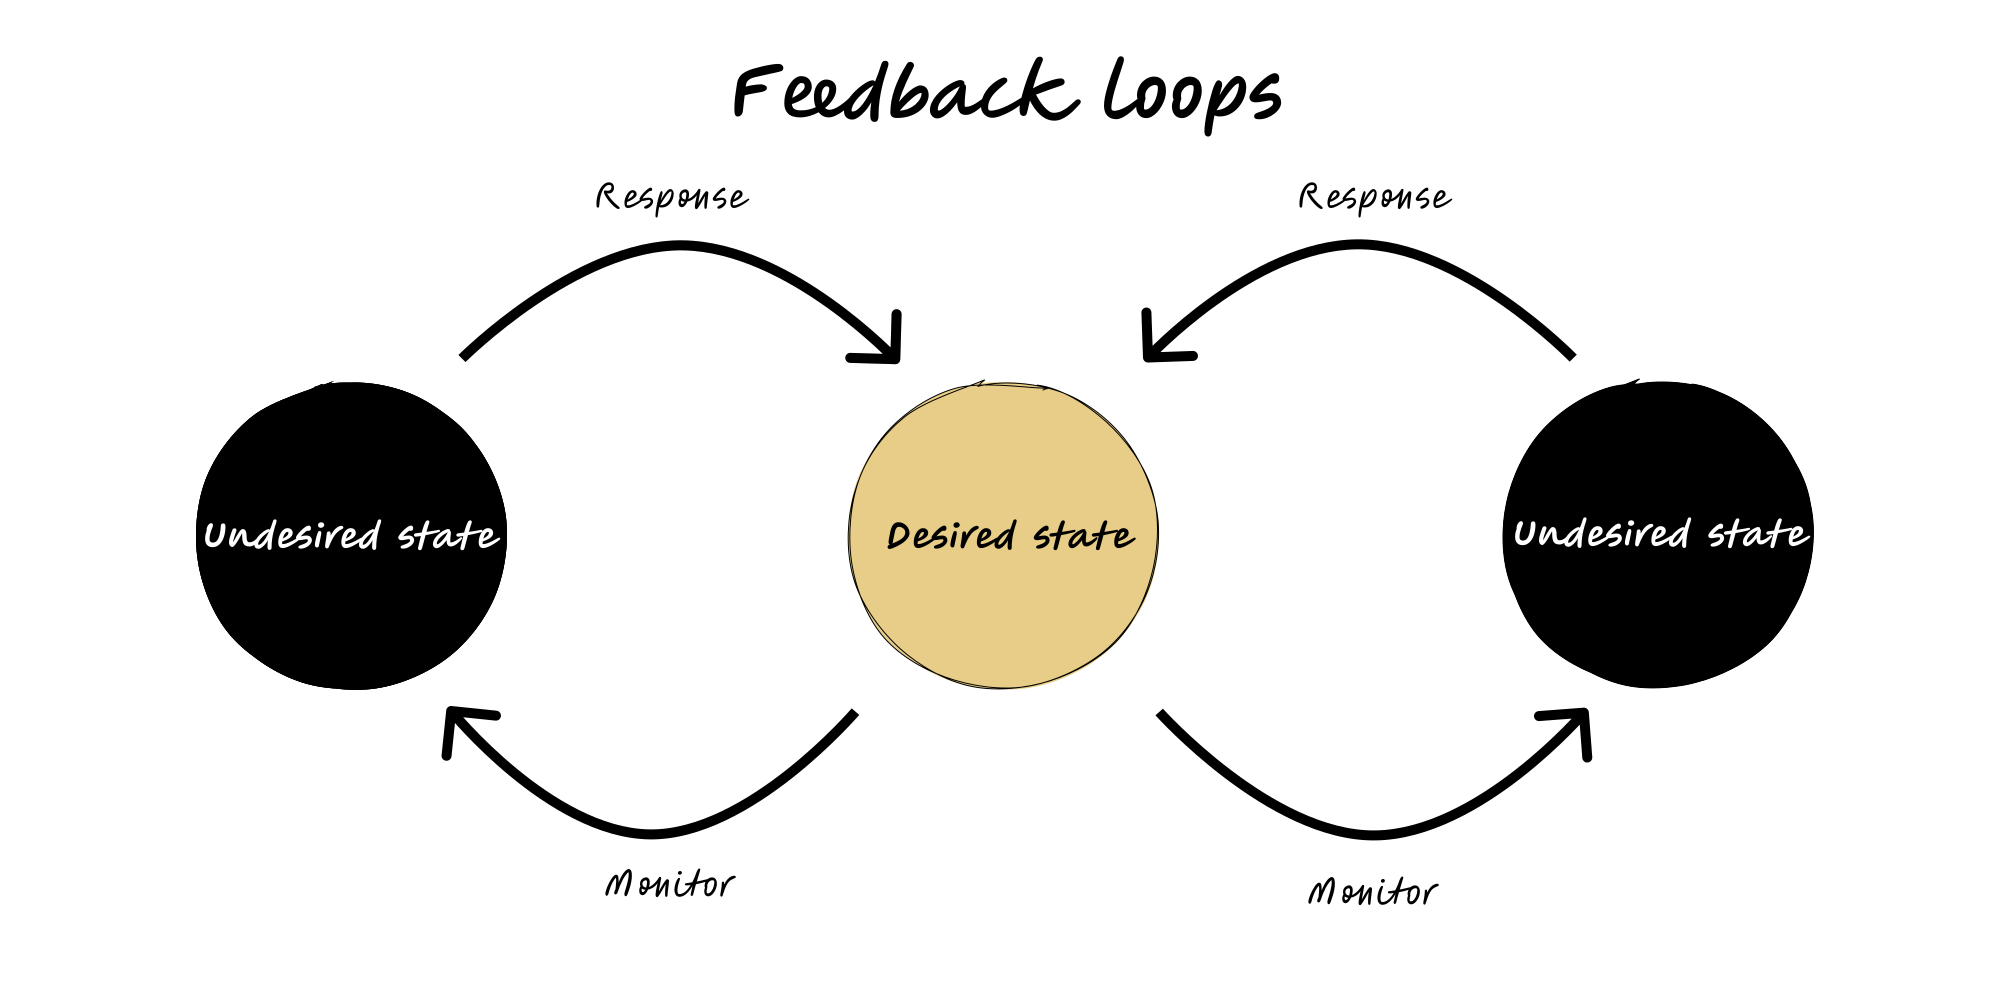
Feedback Loops
Reinforcing and balancing loops drive growth and stability (Meadows).
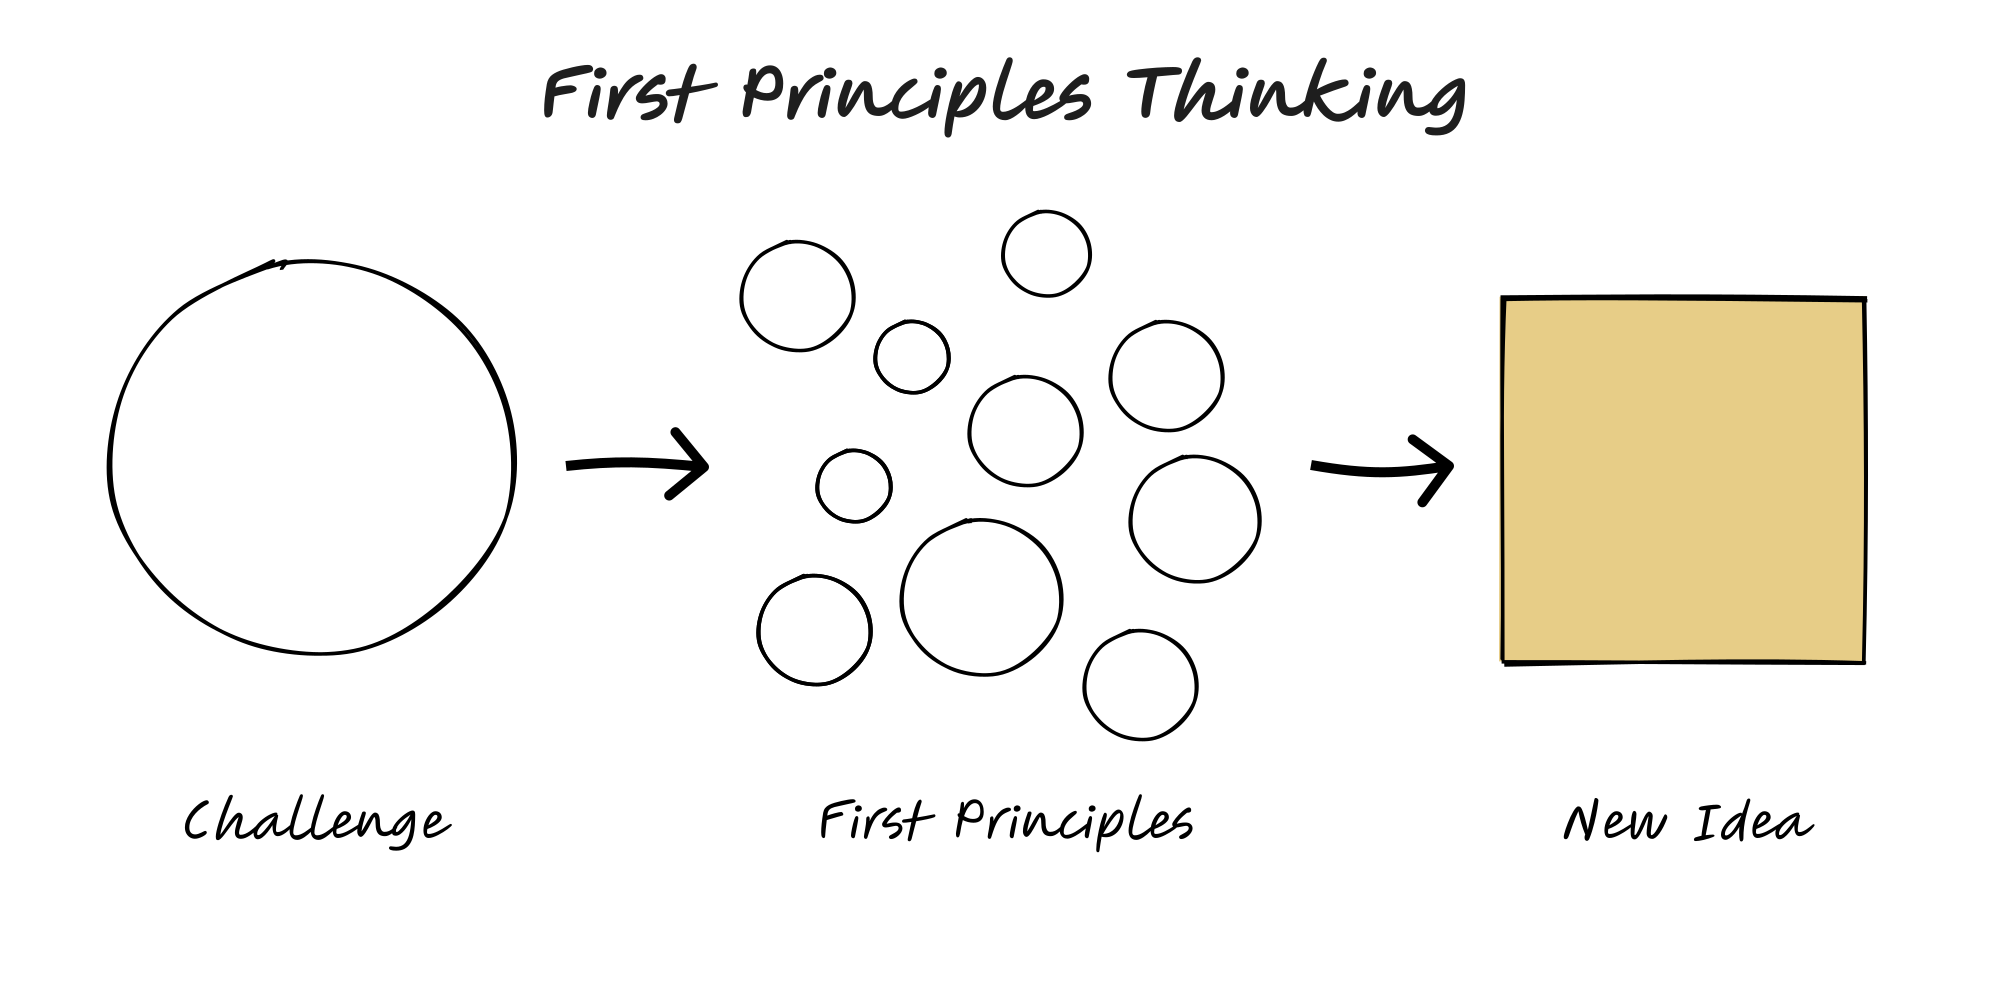
First Principles Thinking
Reduce a problem to its fundamental truths, then reason up from there—ignoring defaults, habits and analogy.
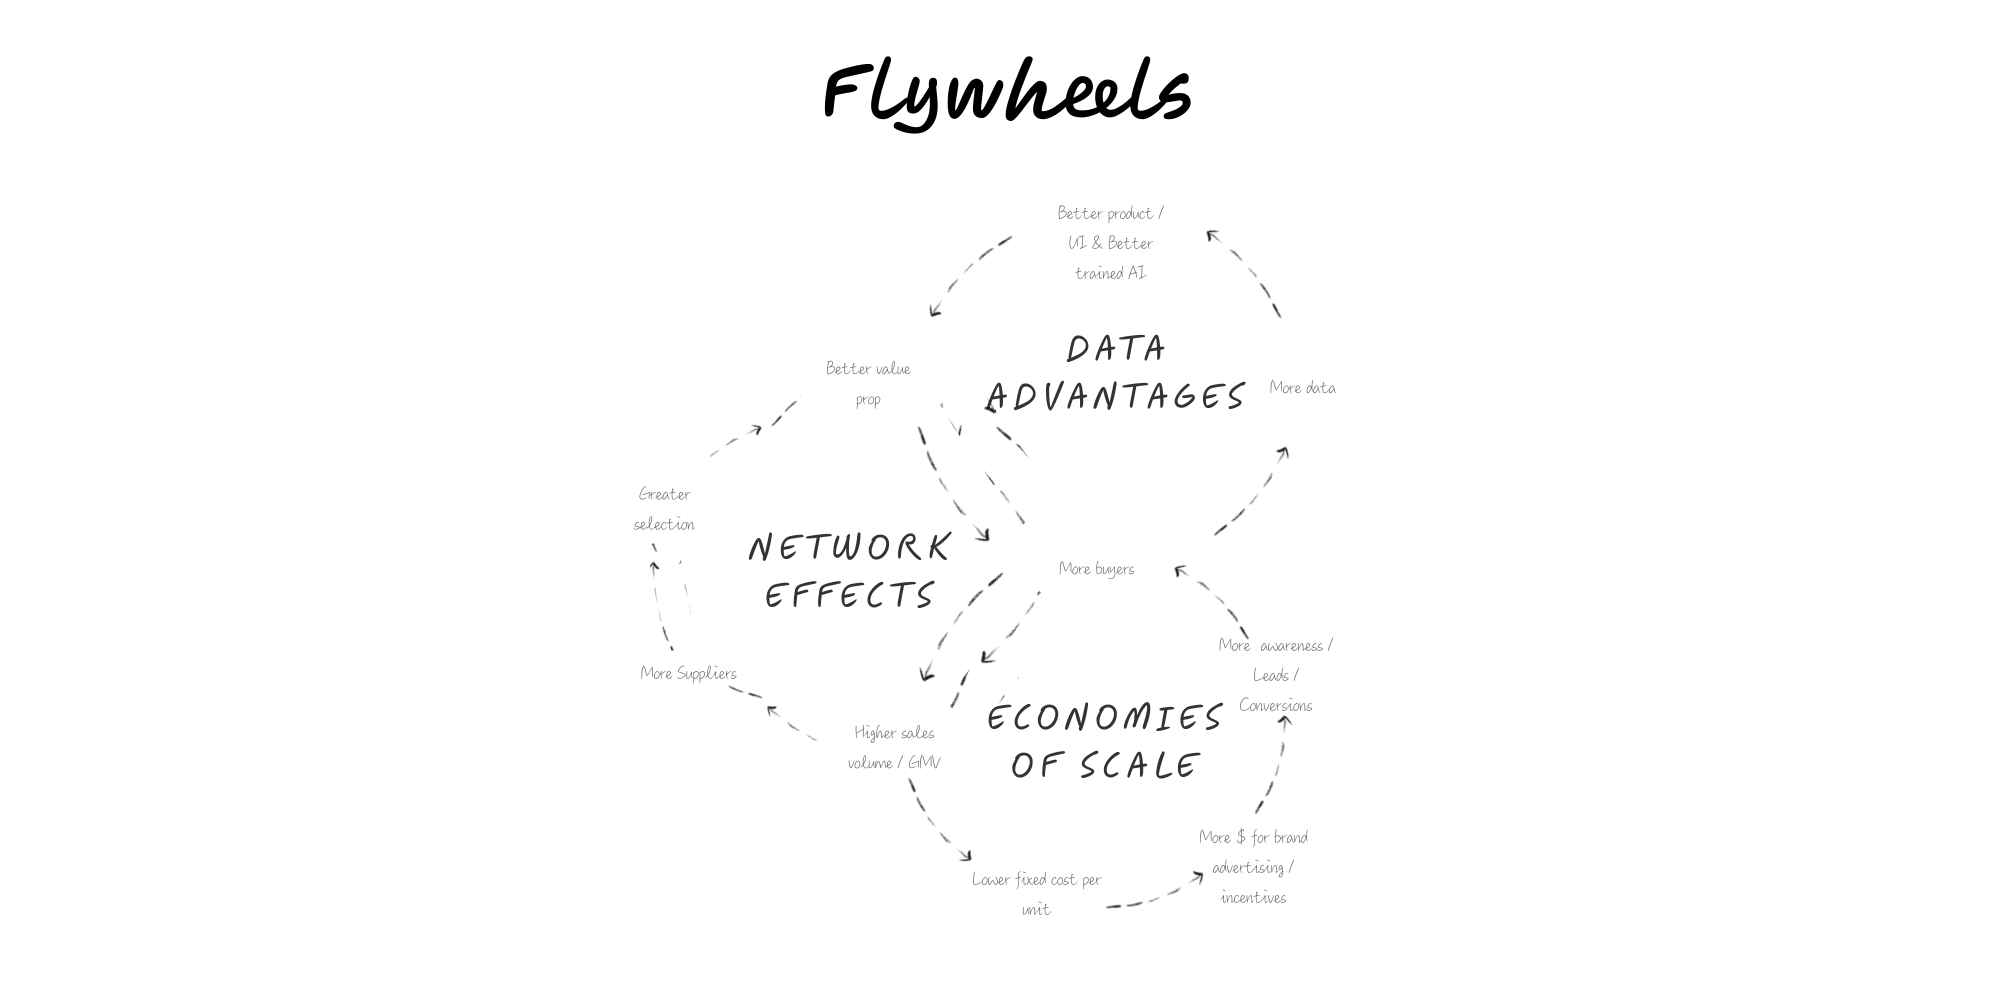
Flywheels
Compounding loops that accelerate with momentum; popularised by Jim Collins.
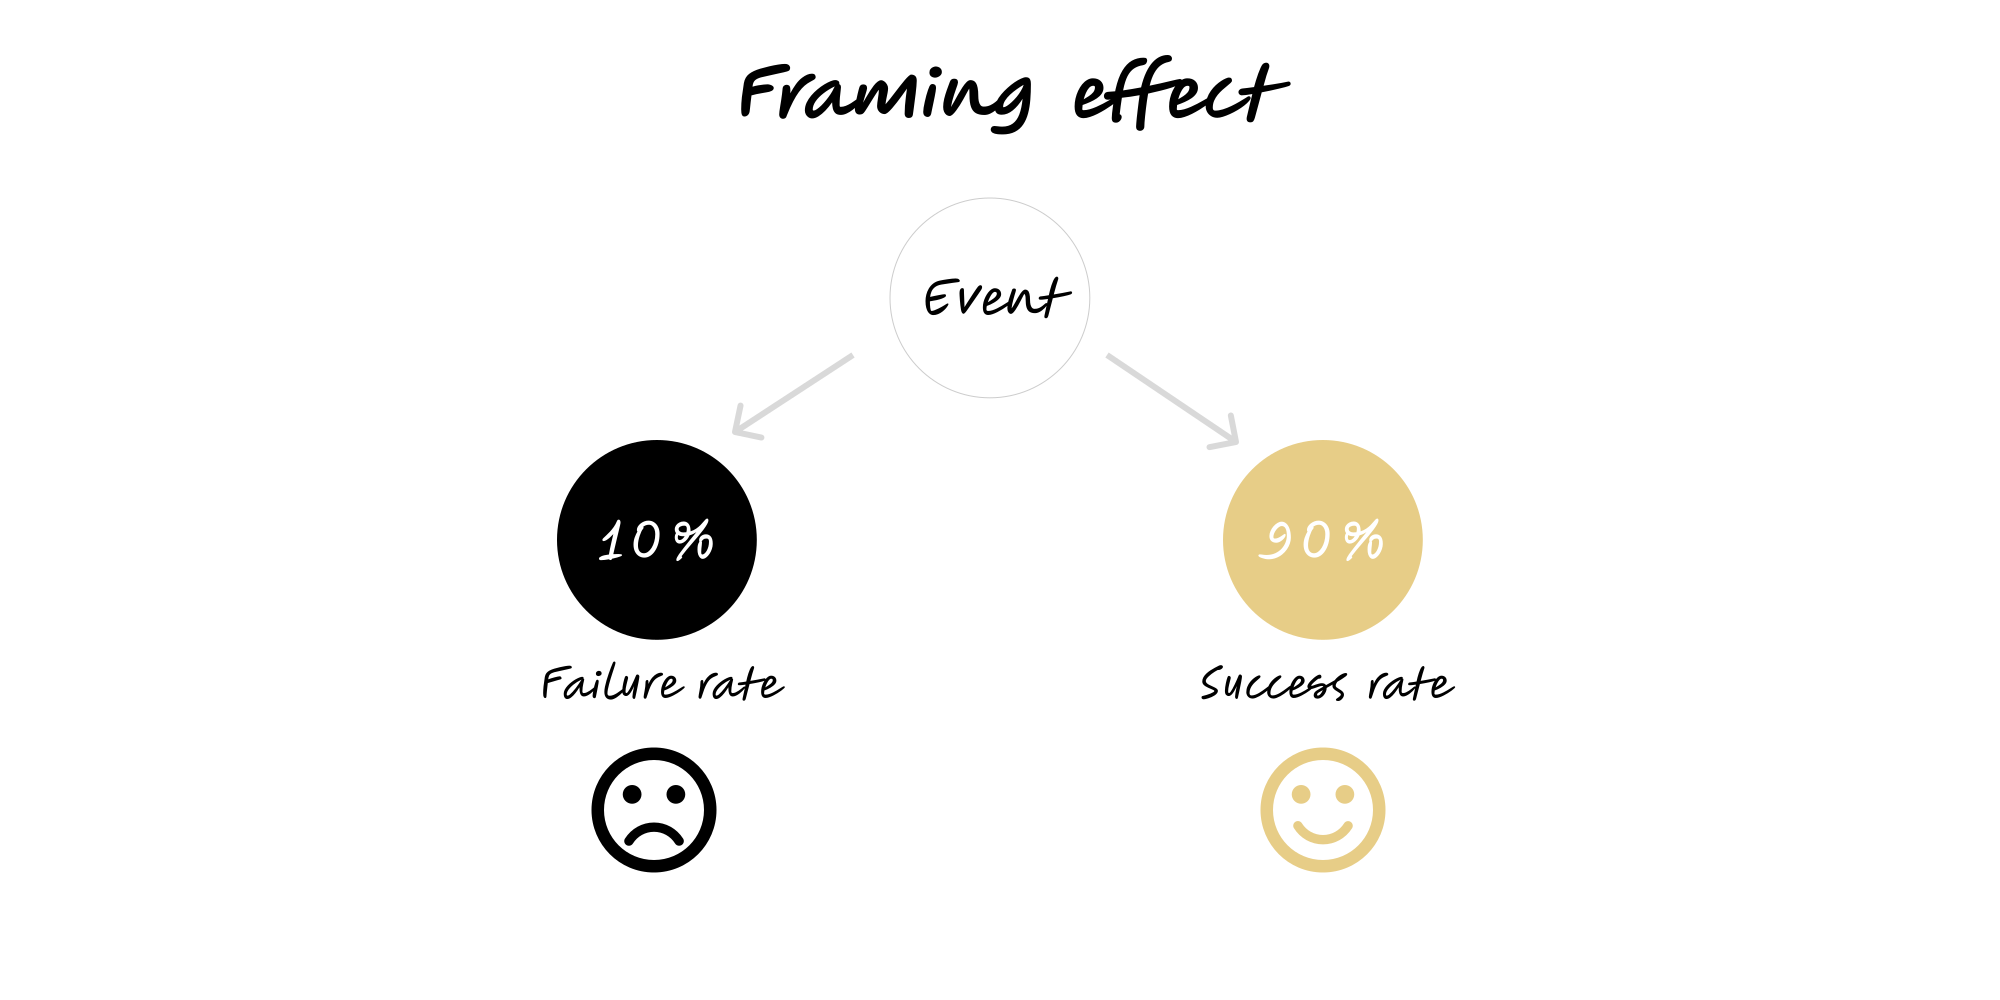
Framing Effect
Choices shift with wording. The same facts, framed differently, lead to different decisions.
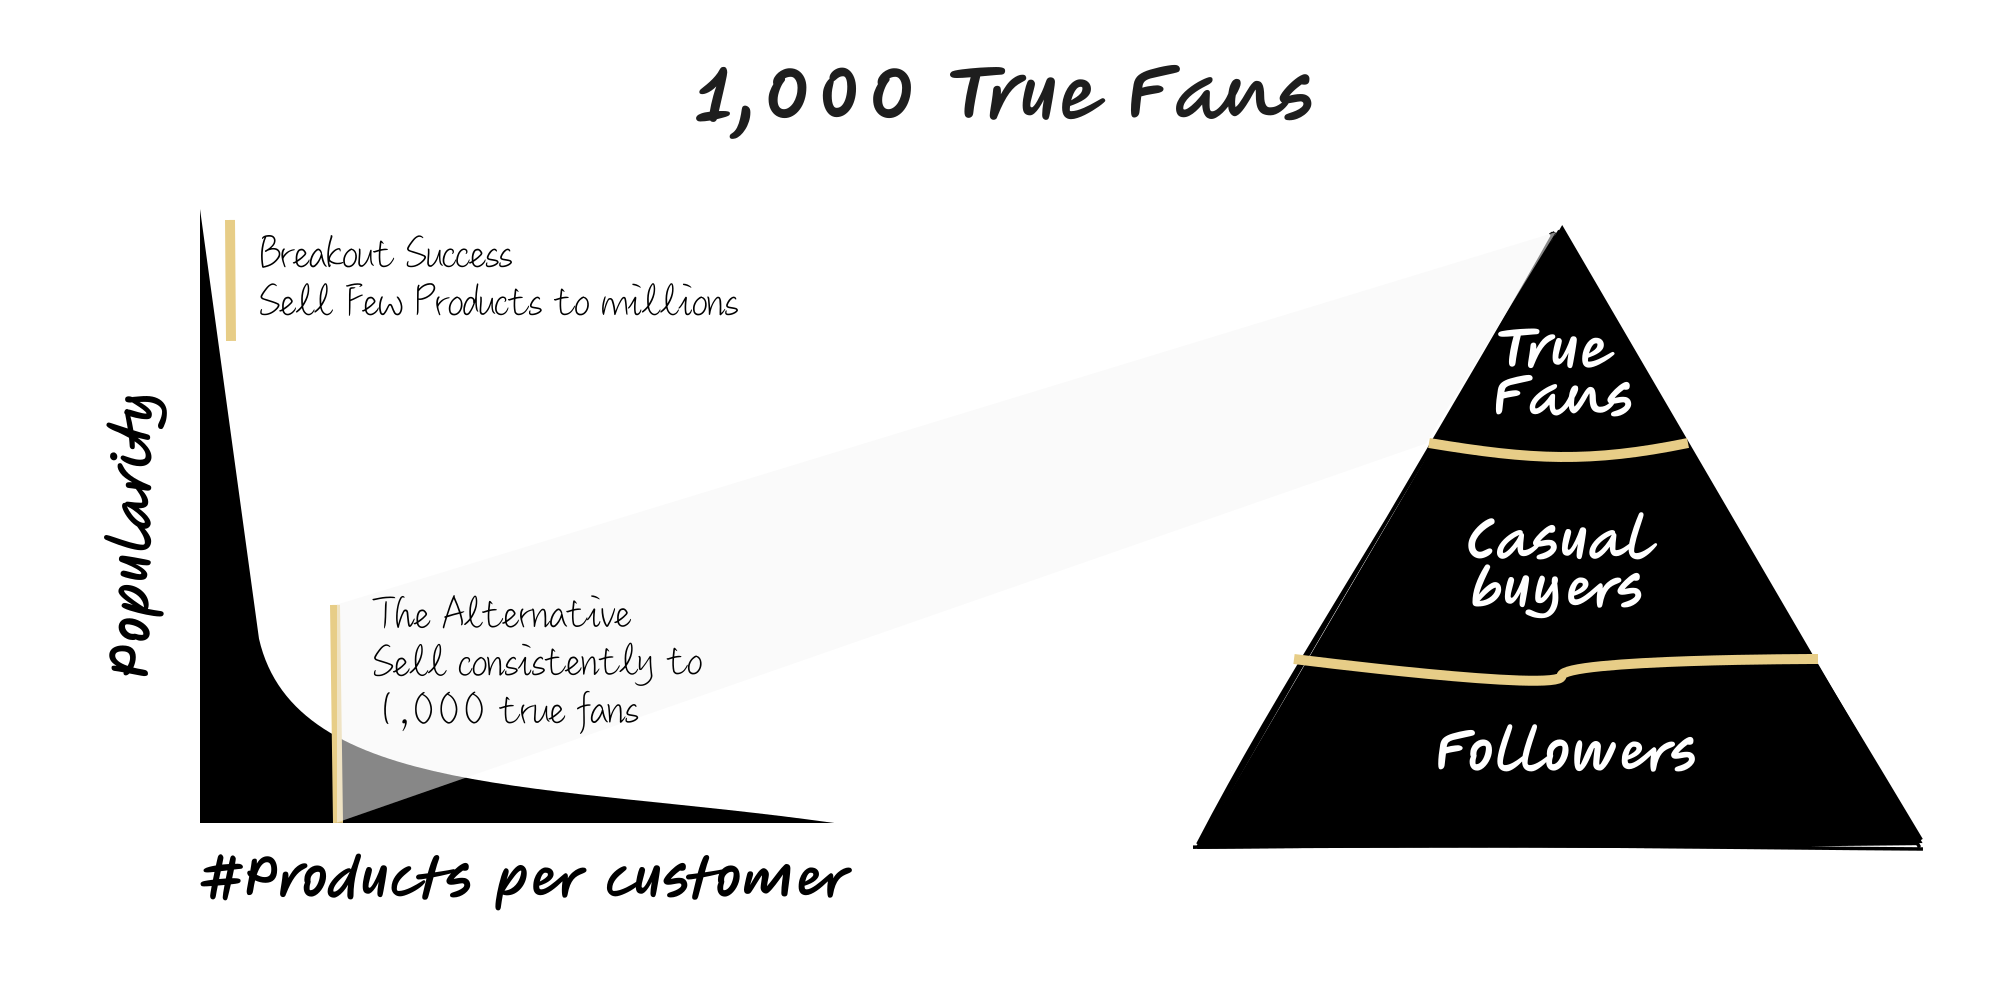
1000 True Fans
Kevin Kelly’s rule of thumb for creators and niche businesses: a direct base of ~1,000 true fans can sustain a venture if ARPU and retention are healthy.
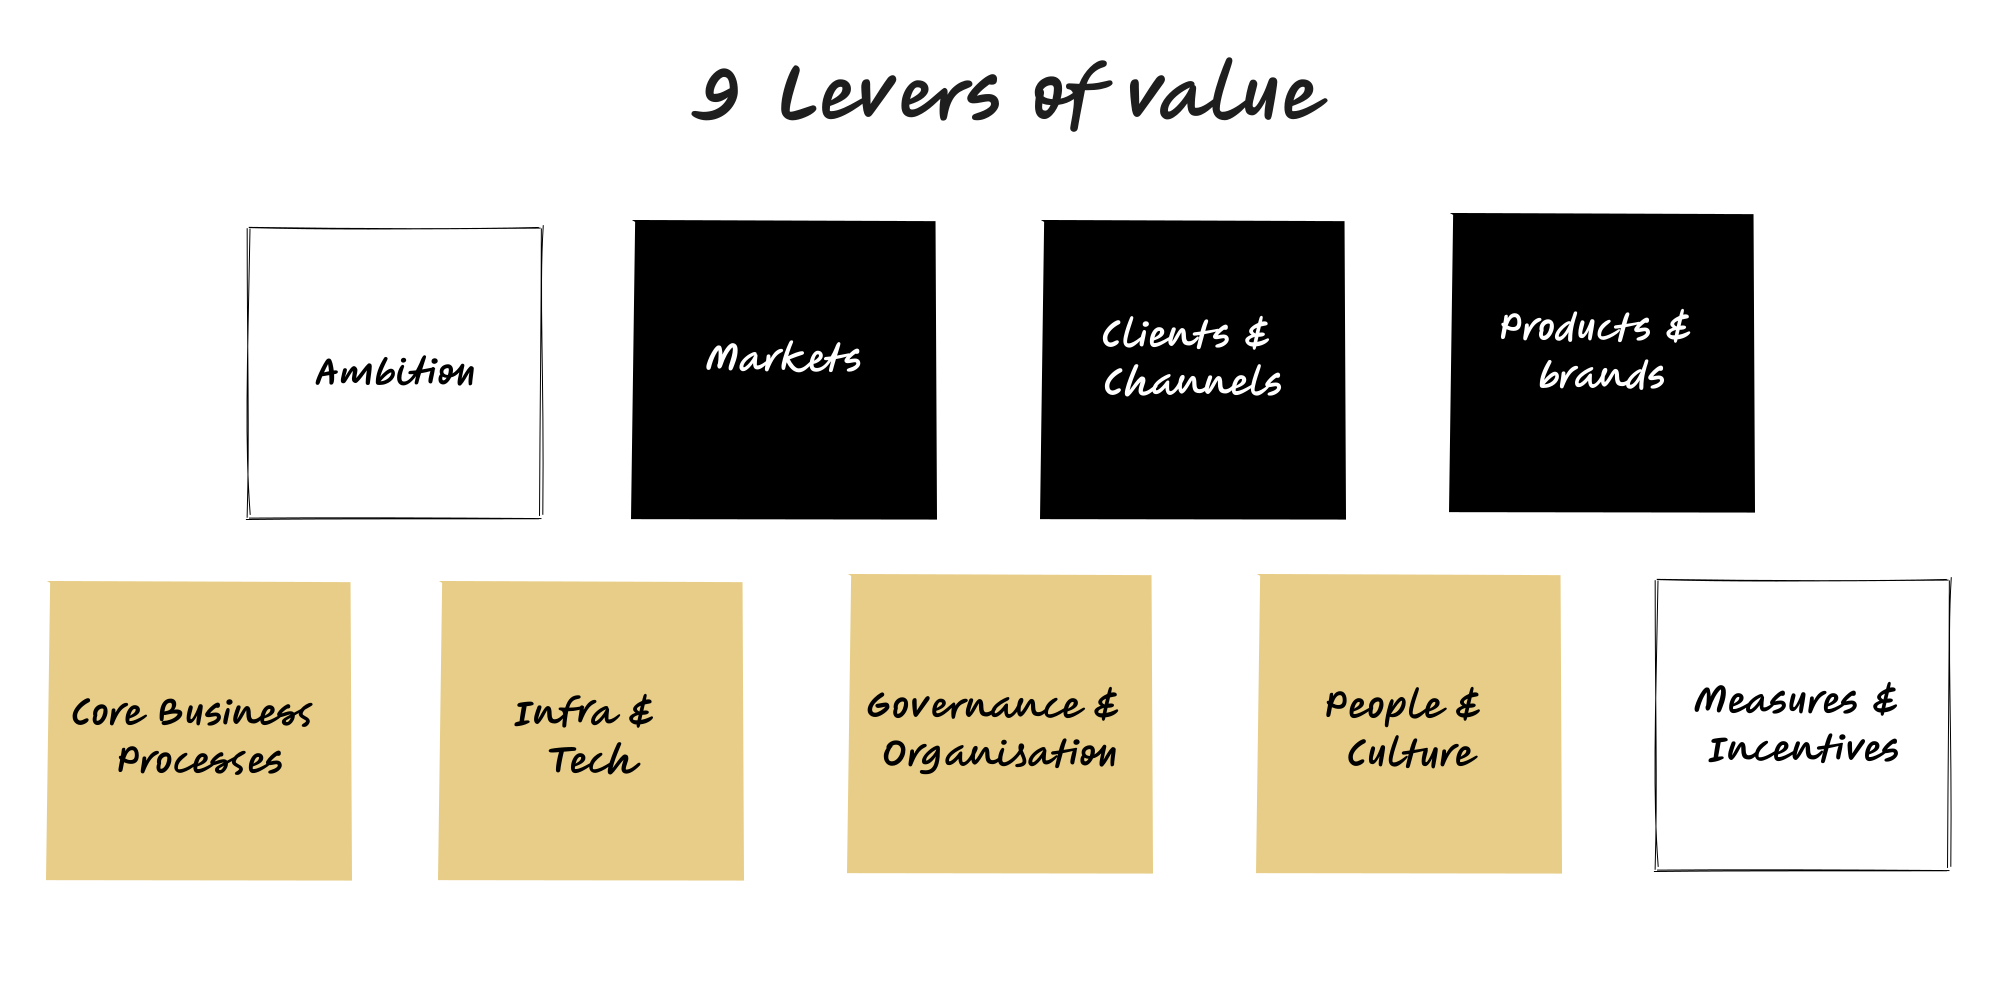
9 Levers of Value
A KPMG framework that links what to aim for (financial ambition), where to play (business model), and how to win (operating model) across nine levers.
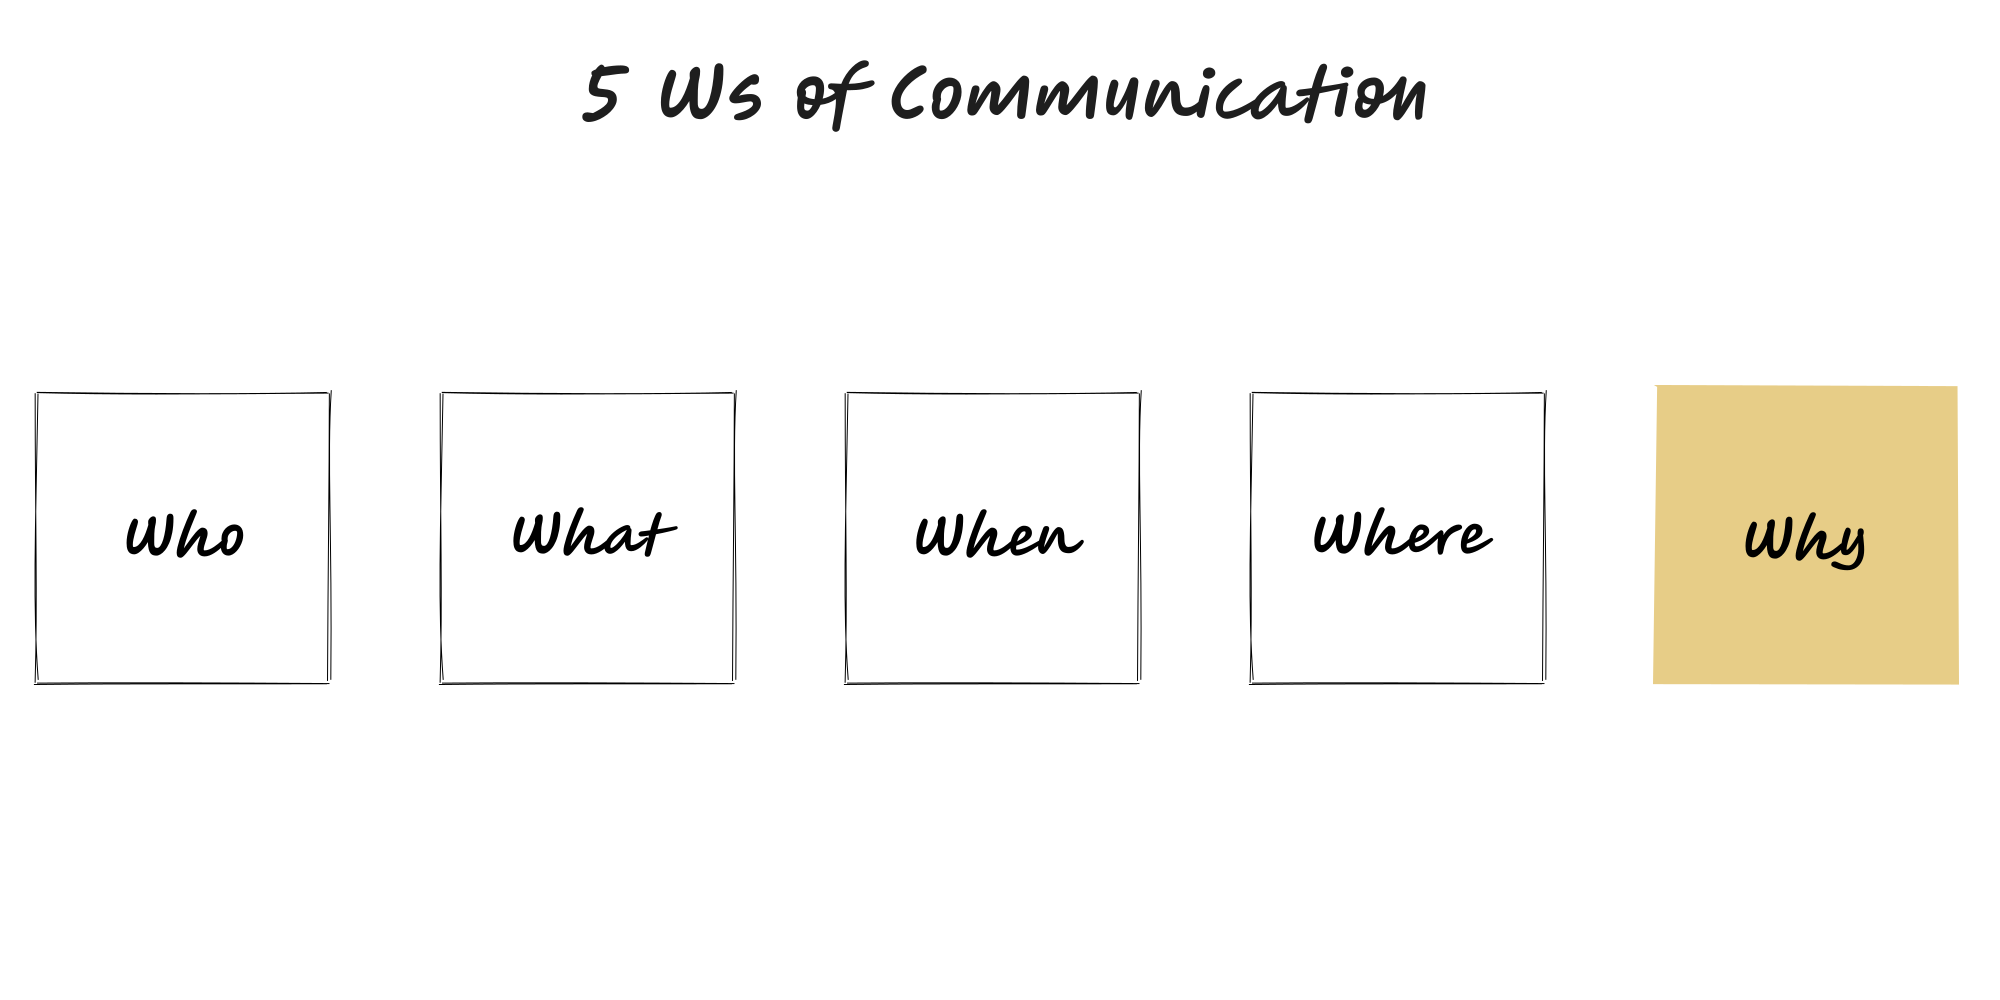
5 Ws of Communication
A compact briefing frame that forces concretes: Who, What, When, Where, Why (and How). Use it to make messages decision-ready and prevent gaps that derail execution.
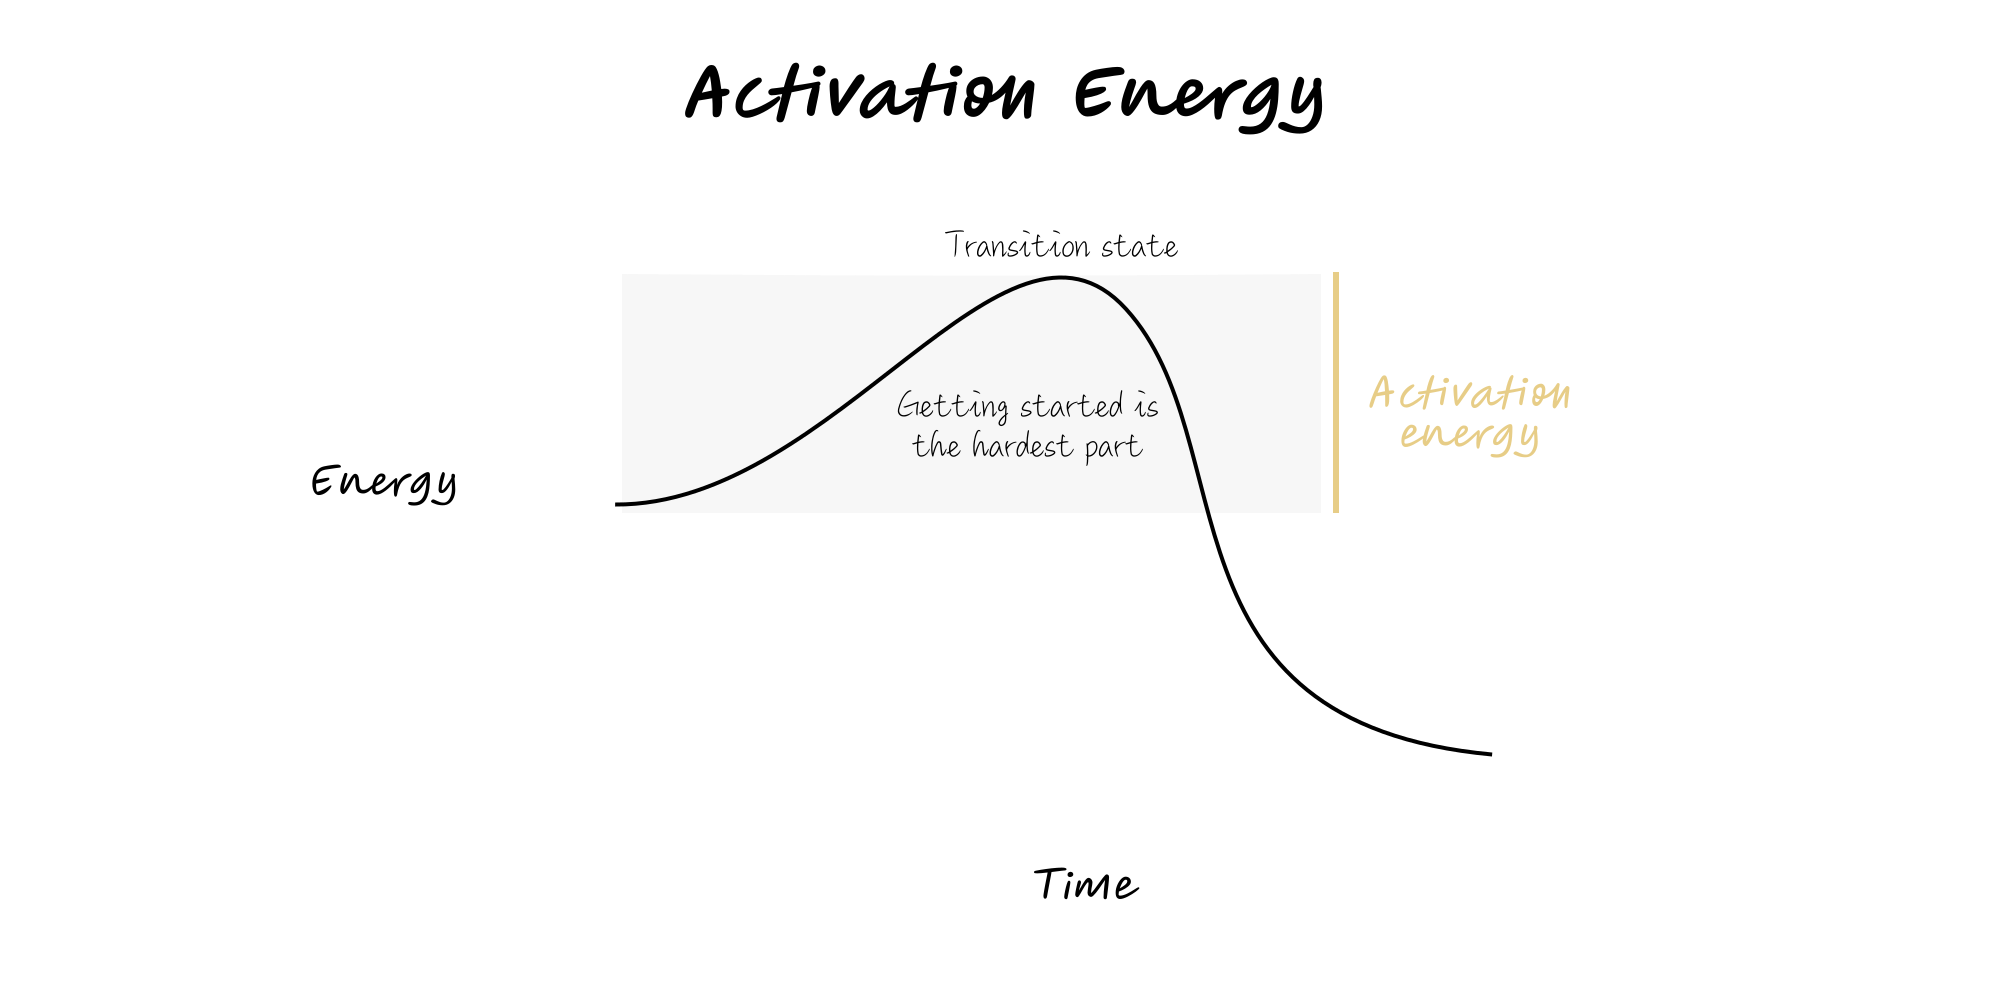
Activation Energy
Borrowed from chemistry and habit design: reduce the upfront effort to make the desired action easier than the default.
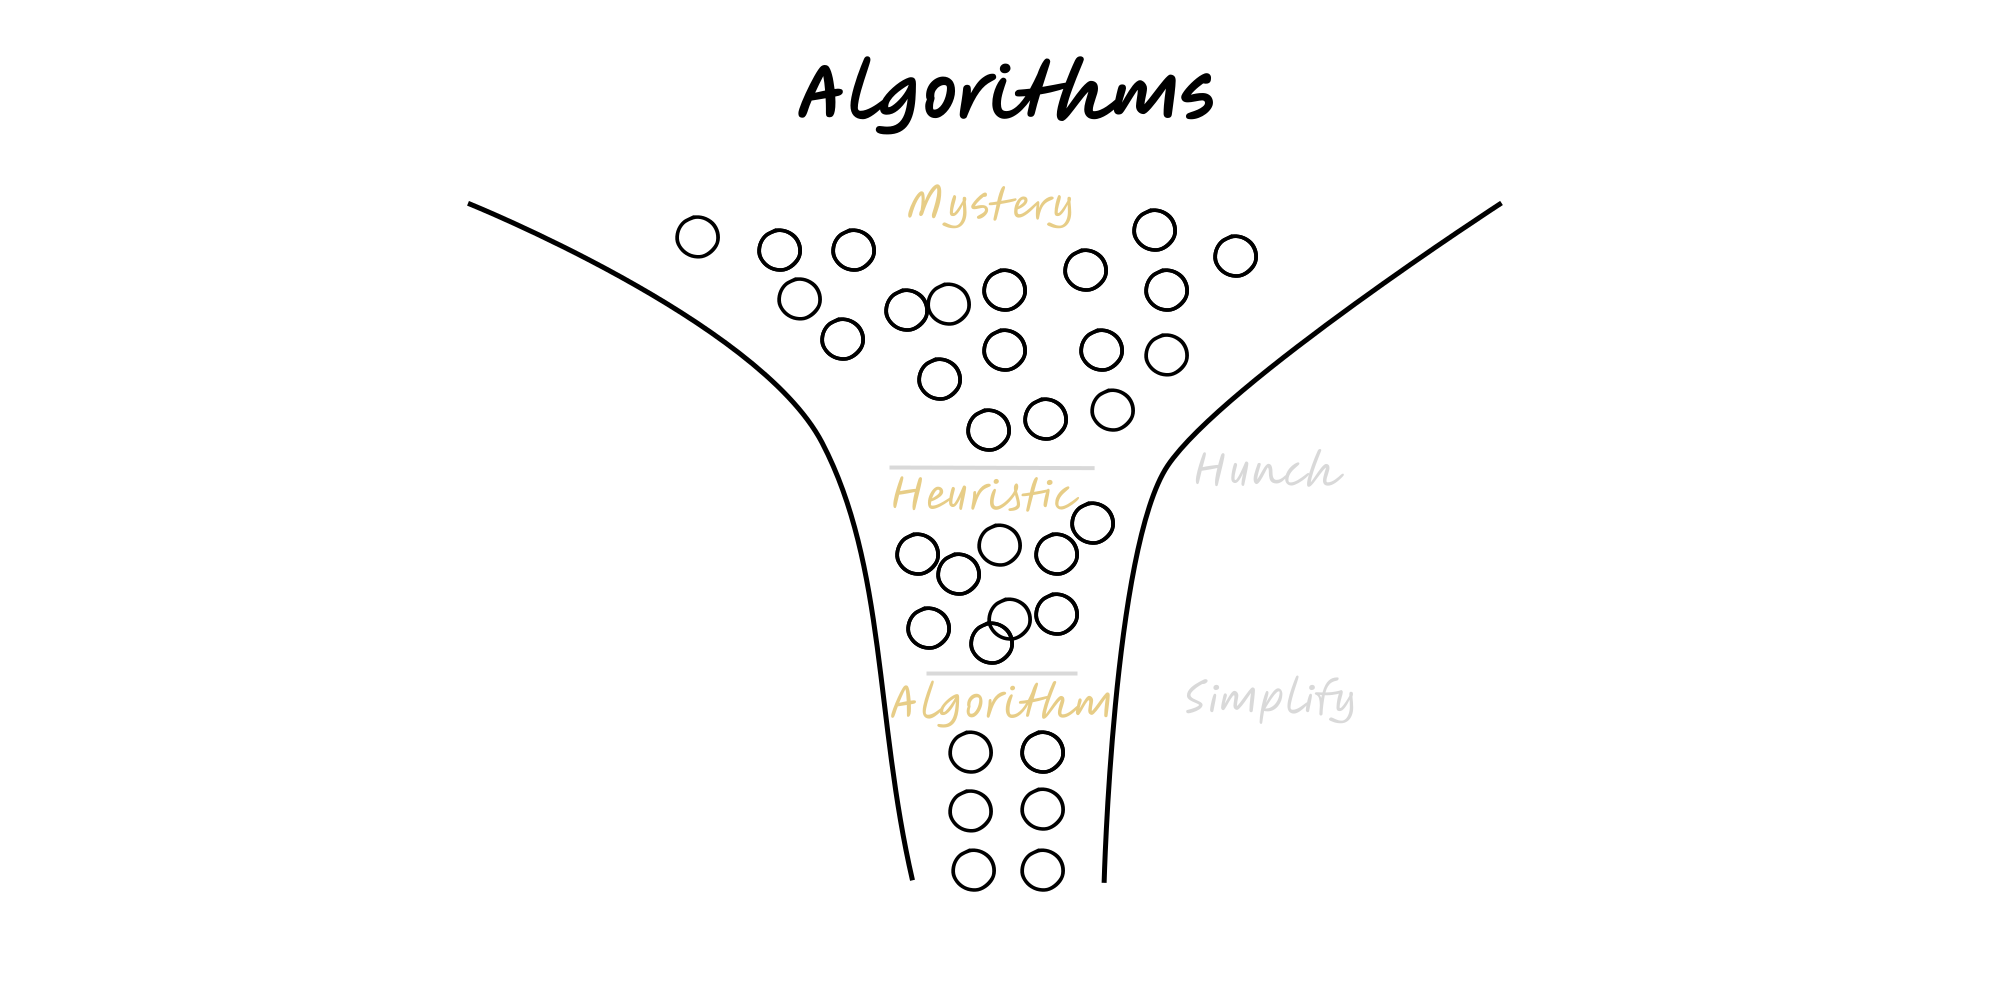
Algorithms
Move work from mystery to heuristic to algorithm – start with a hunch, then simplify until the decision is repeatable and automatable.
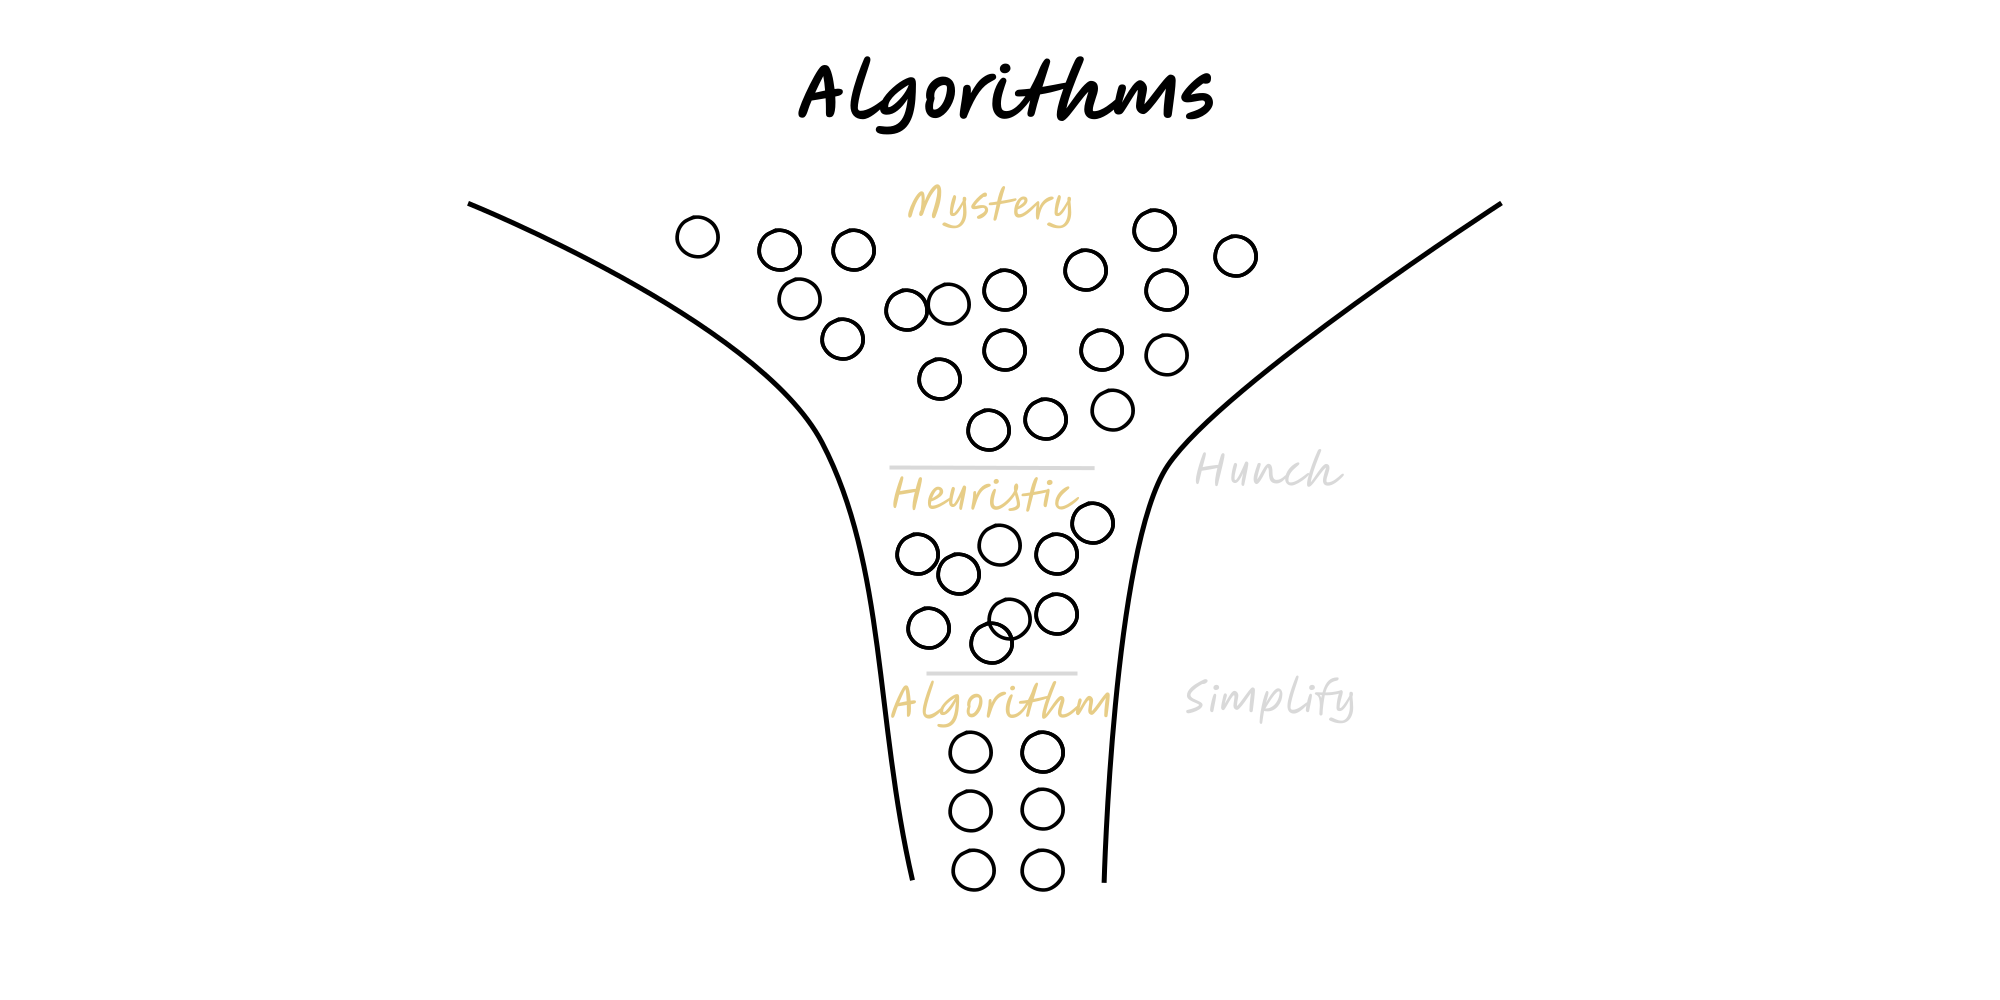
Algorithms
Move work from mystery to heuristic to algorithm – start with a hunch, then simplify until the decision is repeatable and automatable.
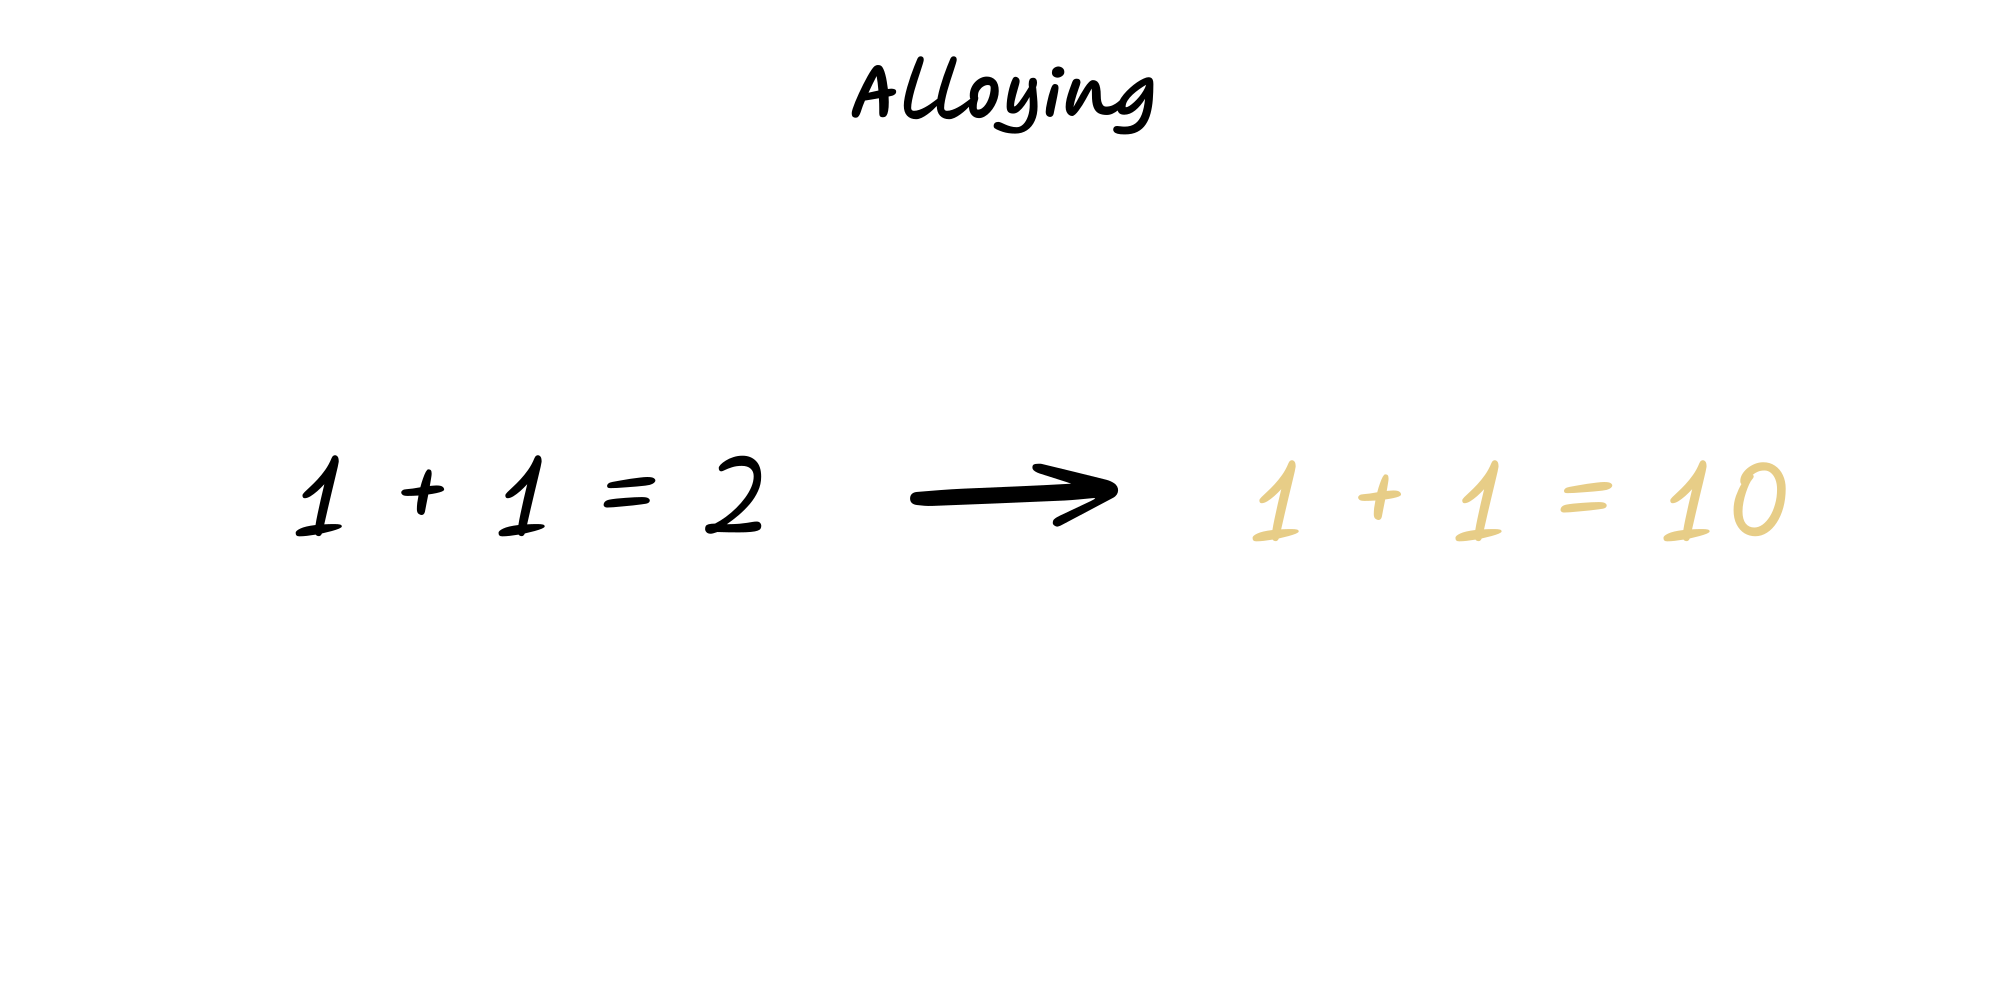
Alloying
Combine complementary capabilities or assets so the composite is stronger than the parts—materials science as a strategy metaphor.
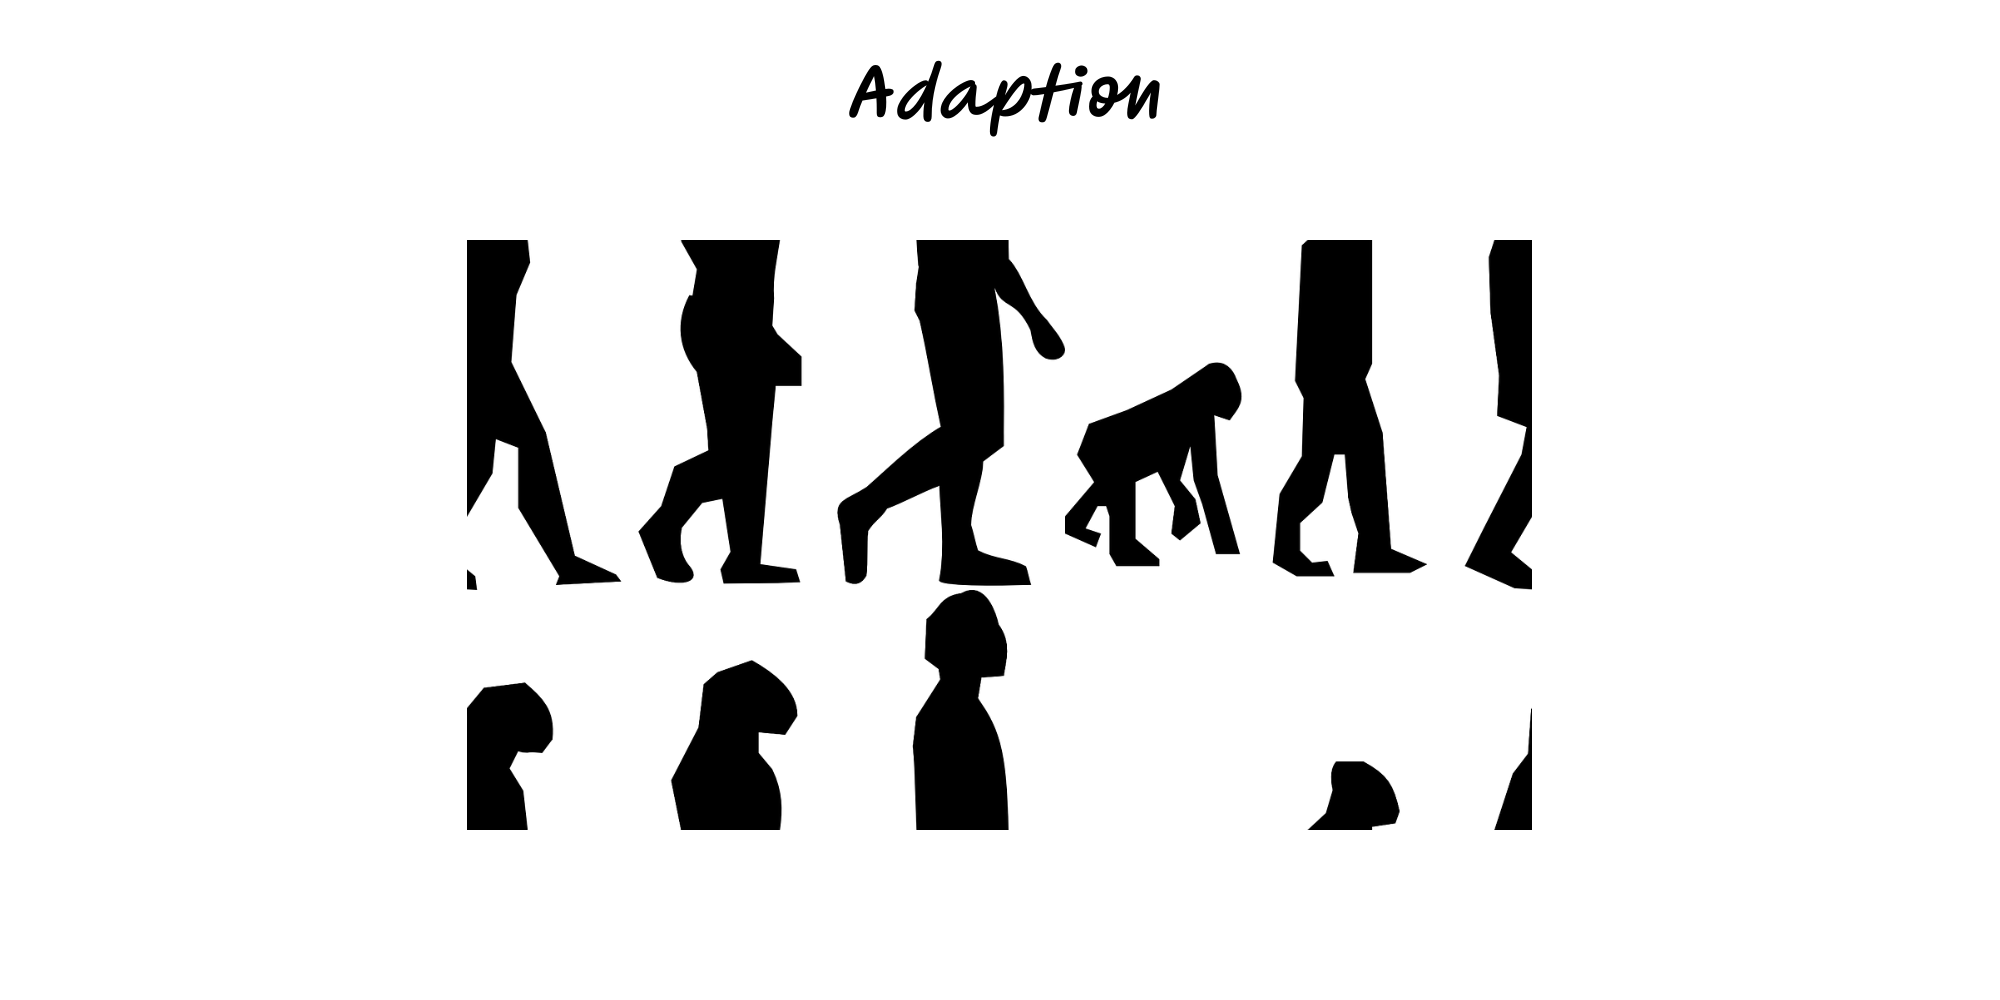
Adaptation
Improve fit to a changing environment by shortening feedback loops, trying small bets, and keeping options open.
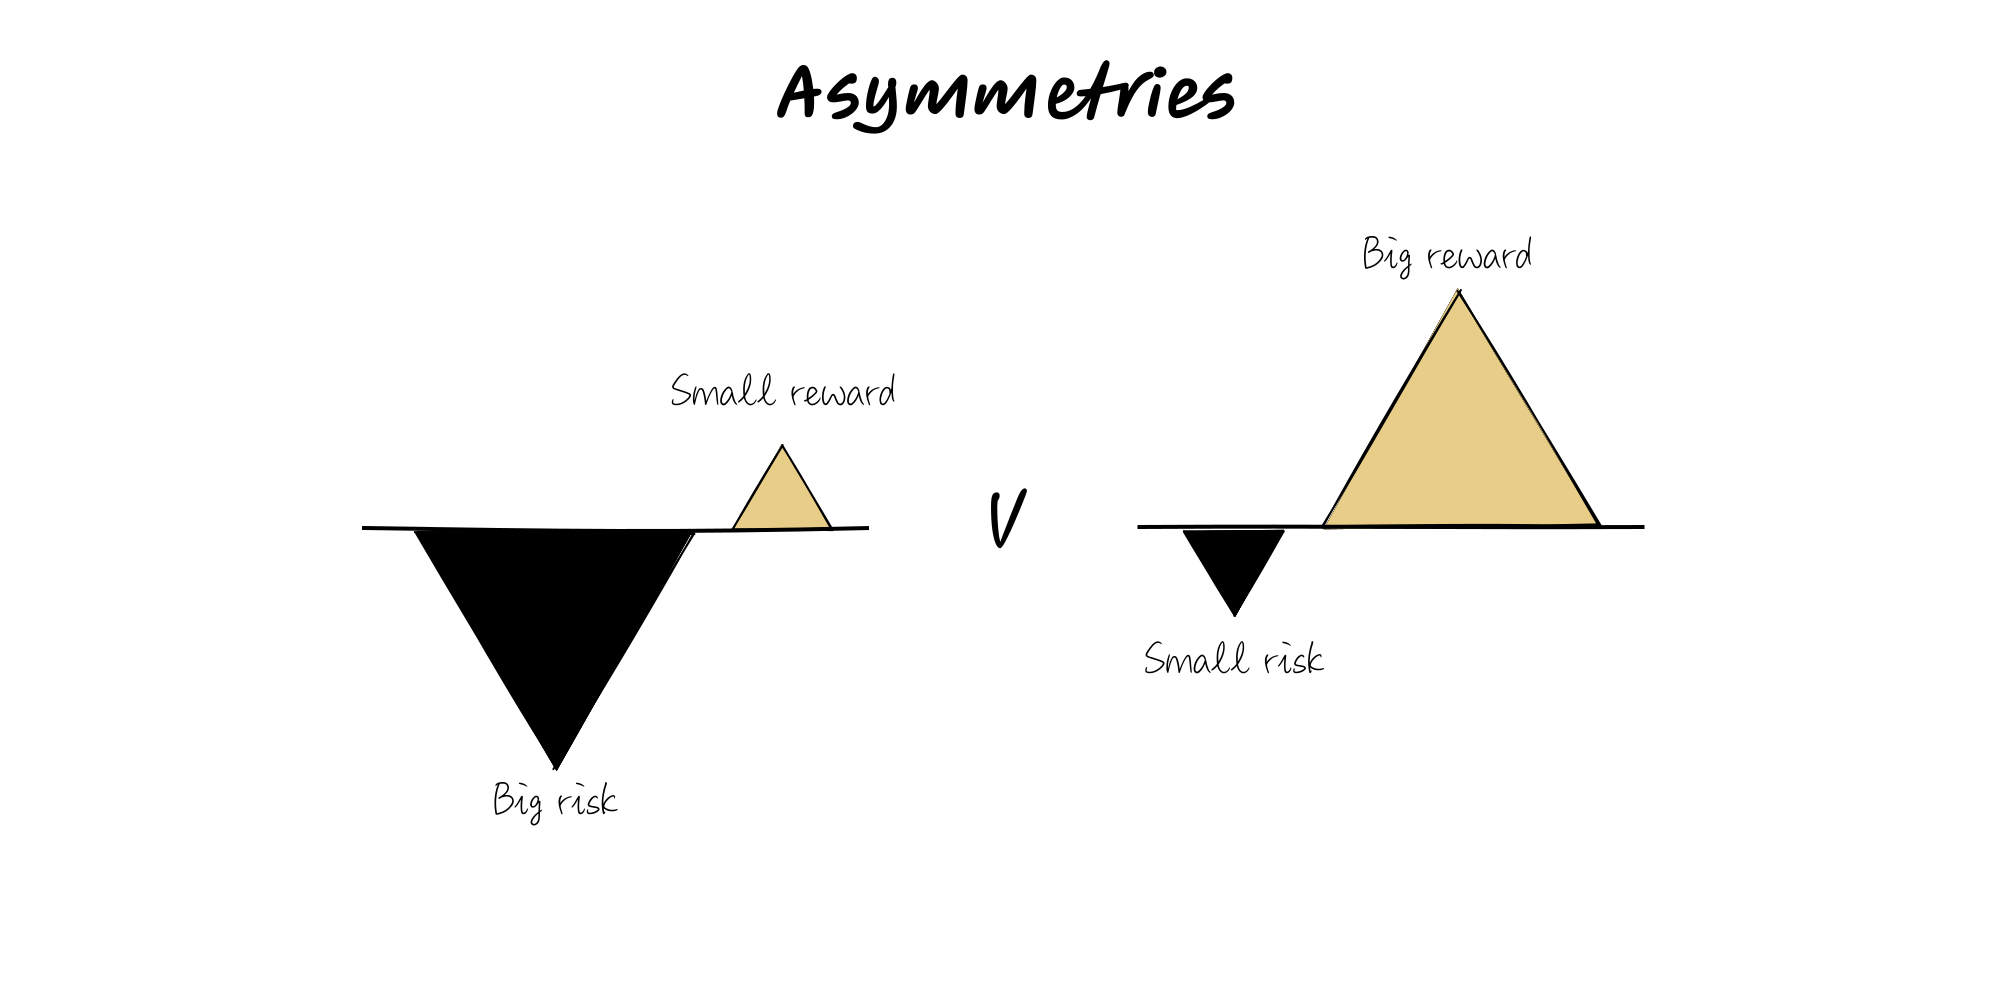
Asymmetries
Exploit one‑sided payoffs or costs (eg, convex bets, reputation effects) where small inputs can create outsized gains.
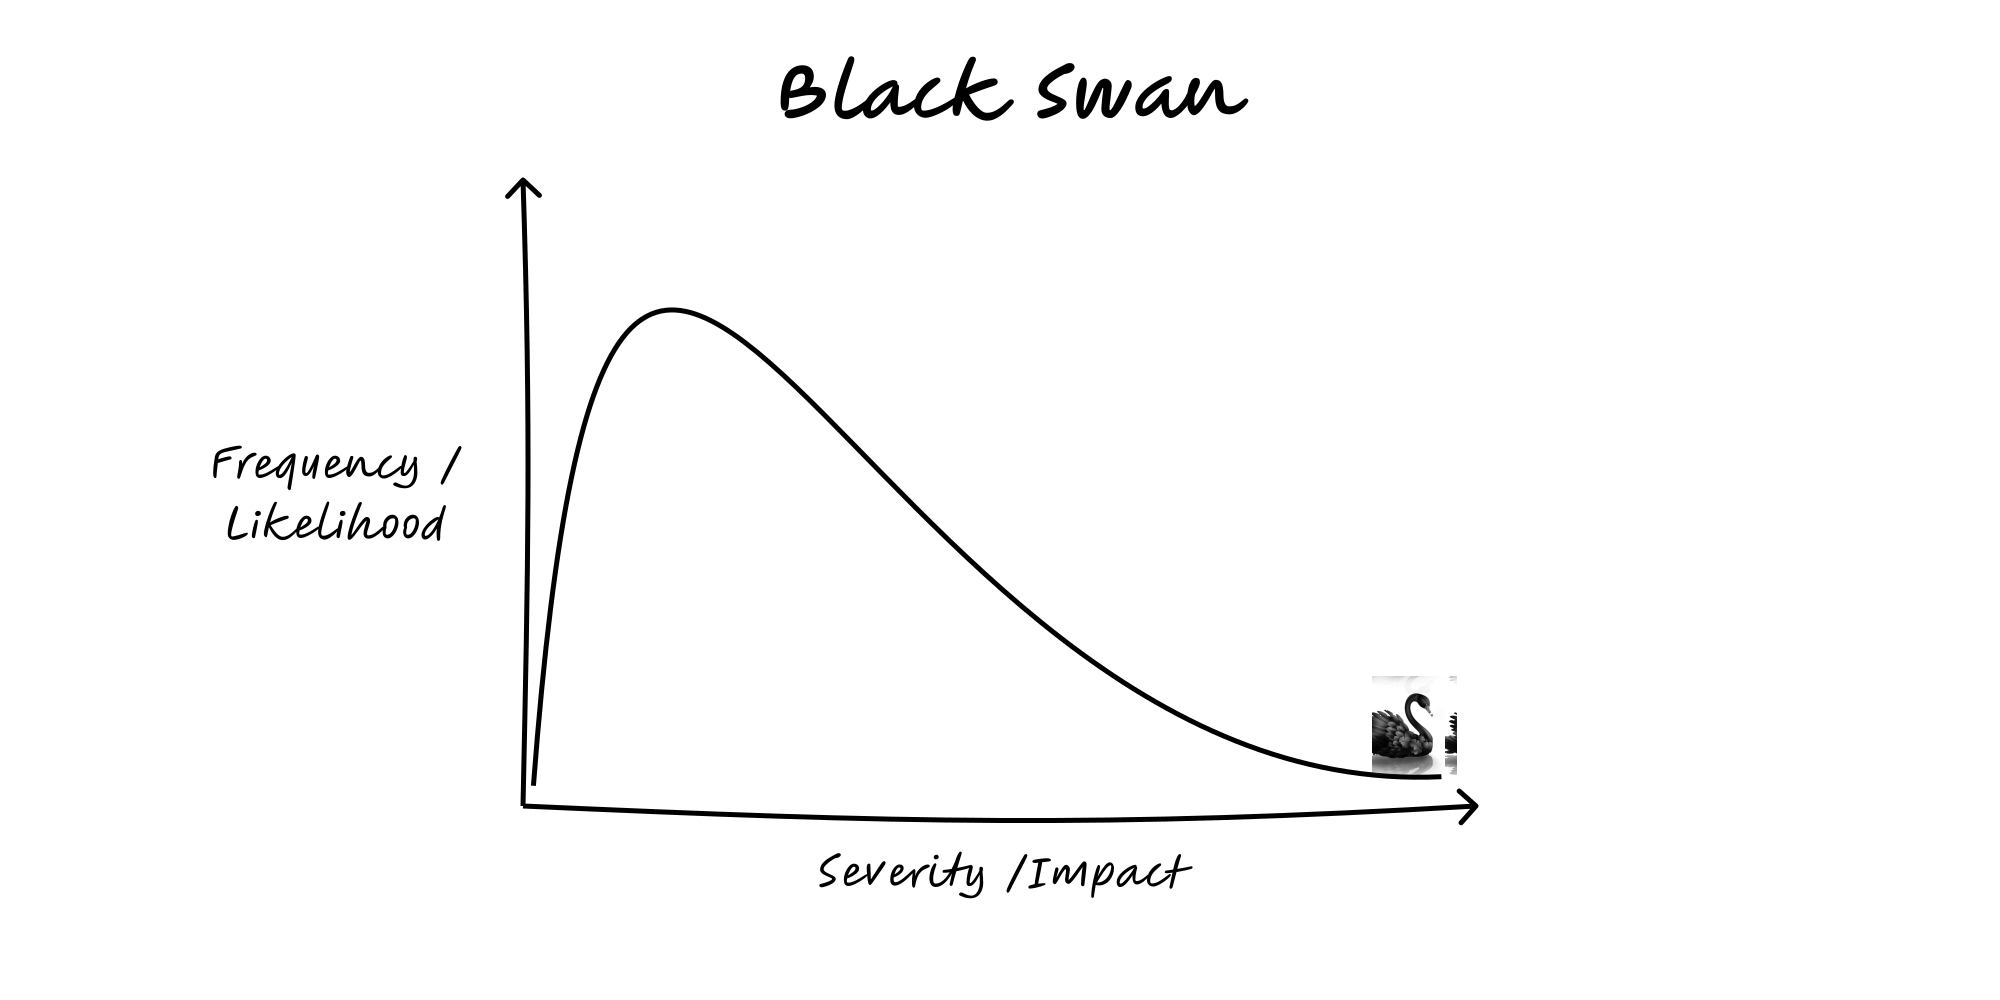
Black Swan
Nassim Taleb’s term for rare, high‑impact, retrospectively ‘obvious’ events.

Bottlenecks
Flow moves at the pace of its constraint—improve the bottleneck to improve the whole.
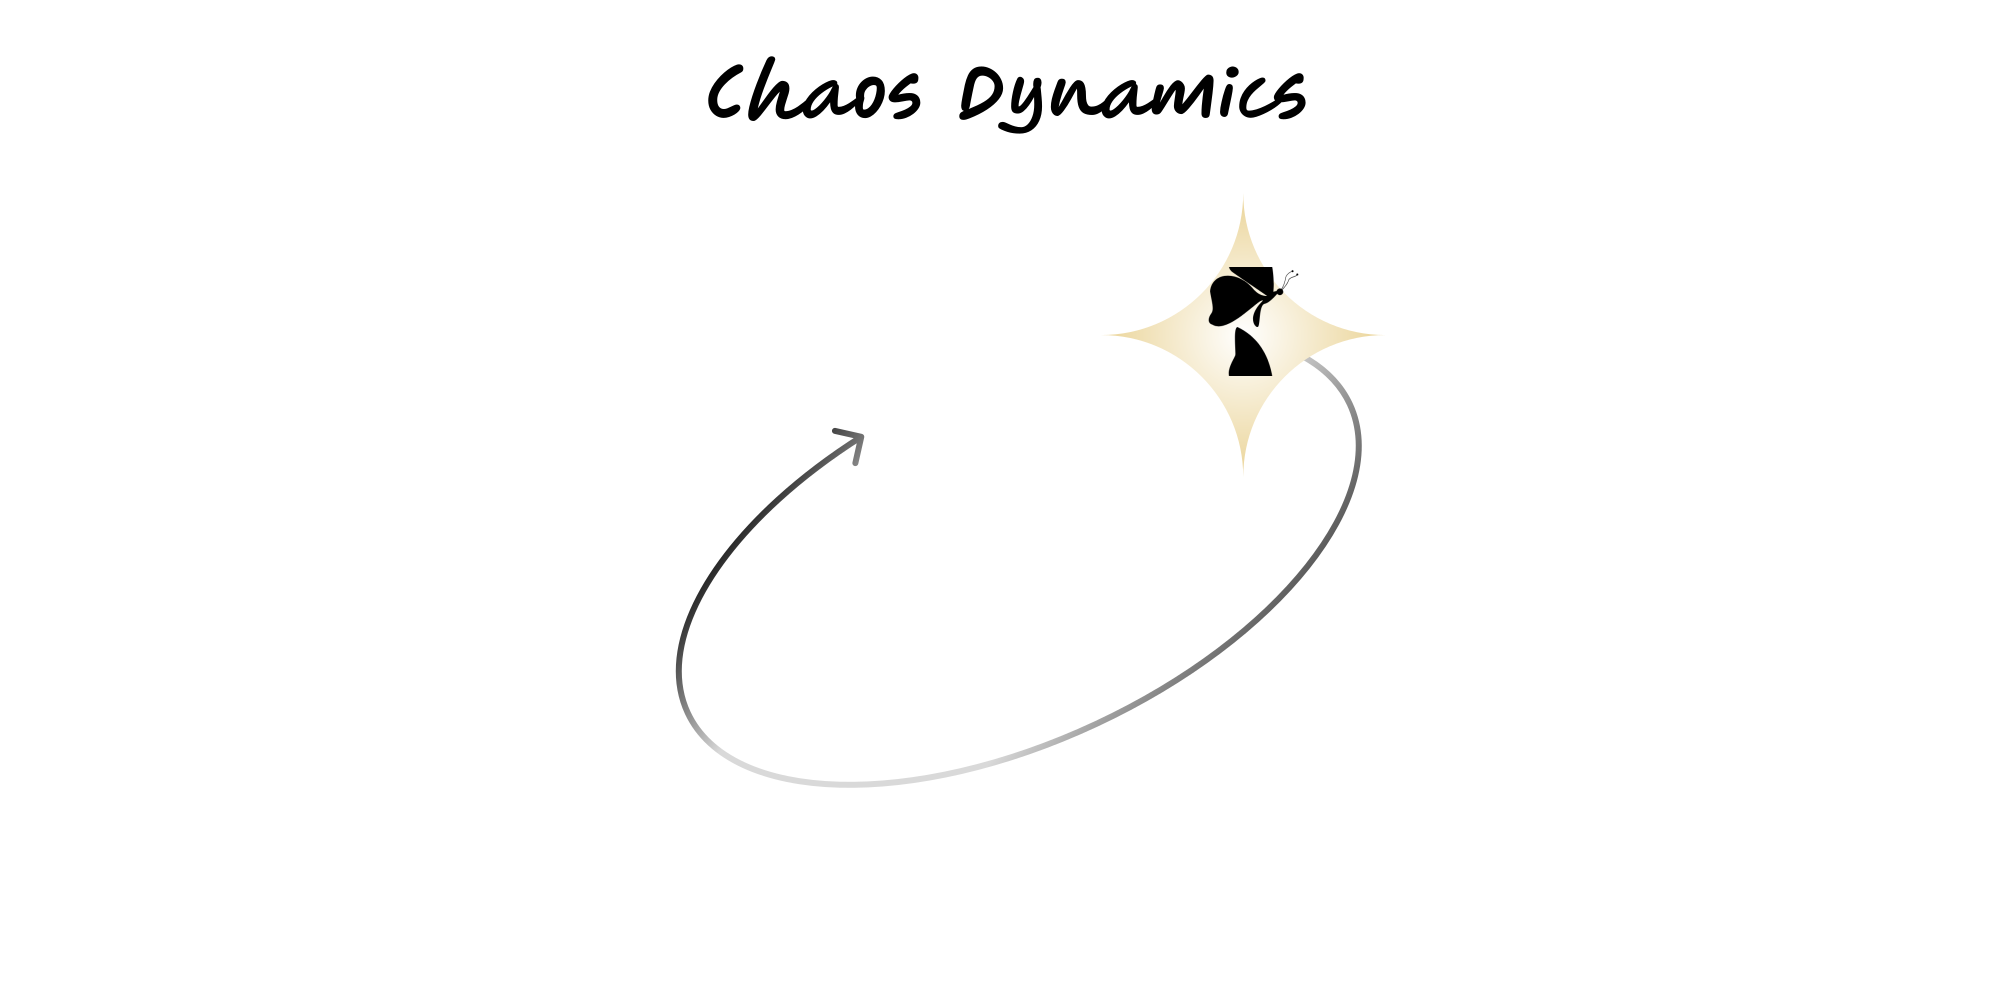
Chaos Dynamics
Sensitivity to initial conditions and non‑linear feedbacks can make long‑range prediction impossible; manage by bounds, not points.
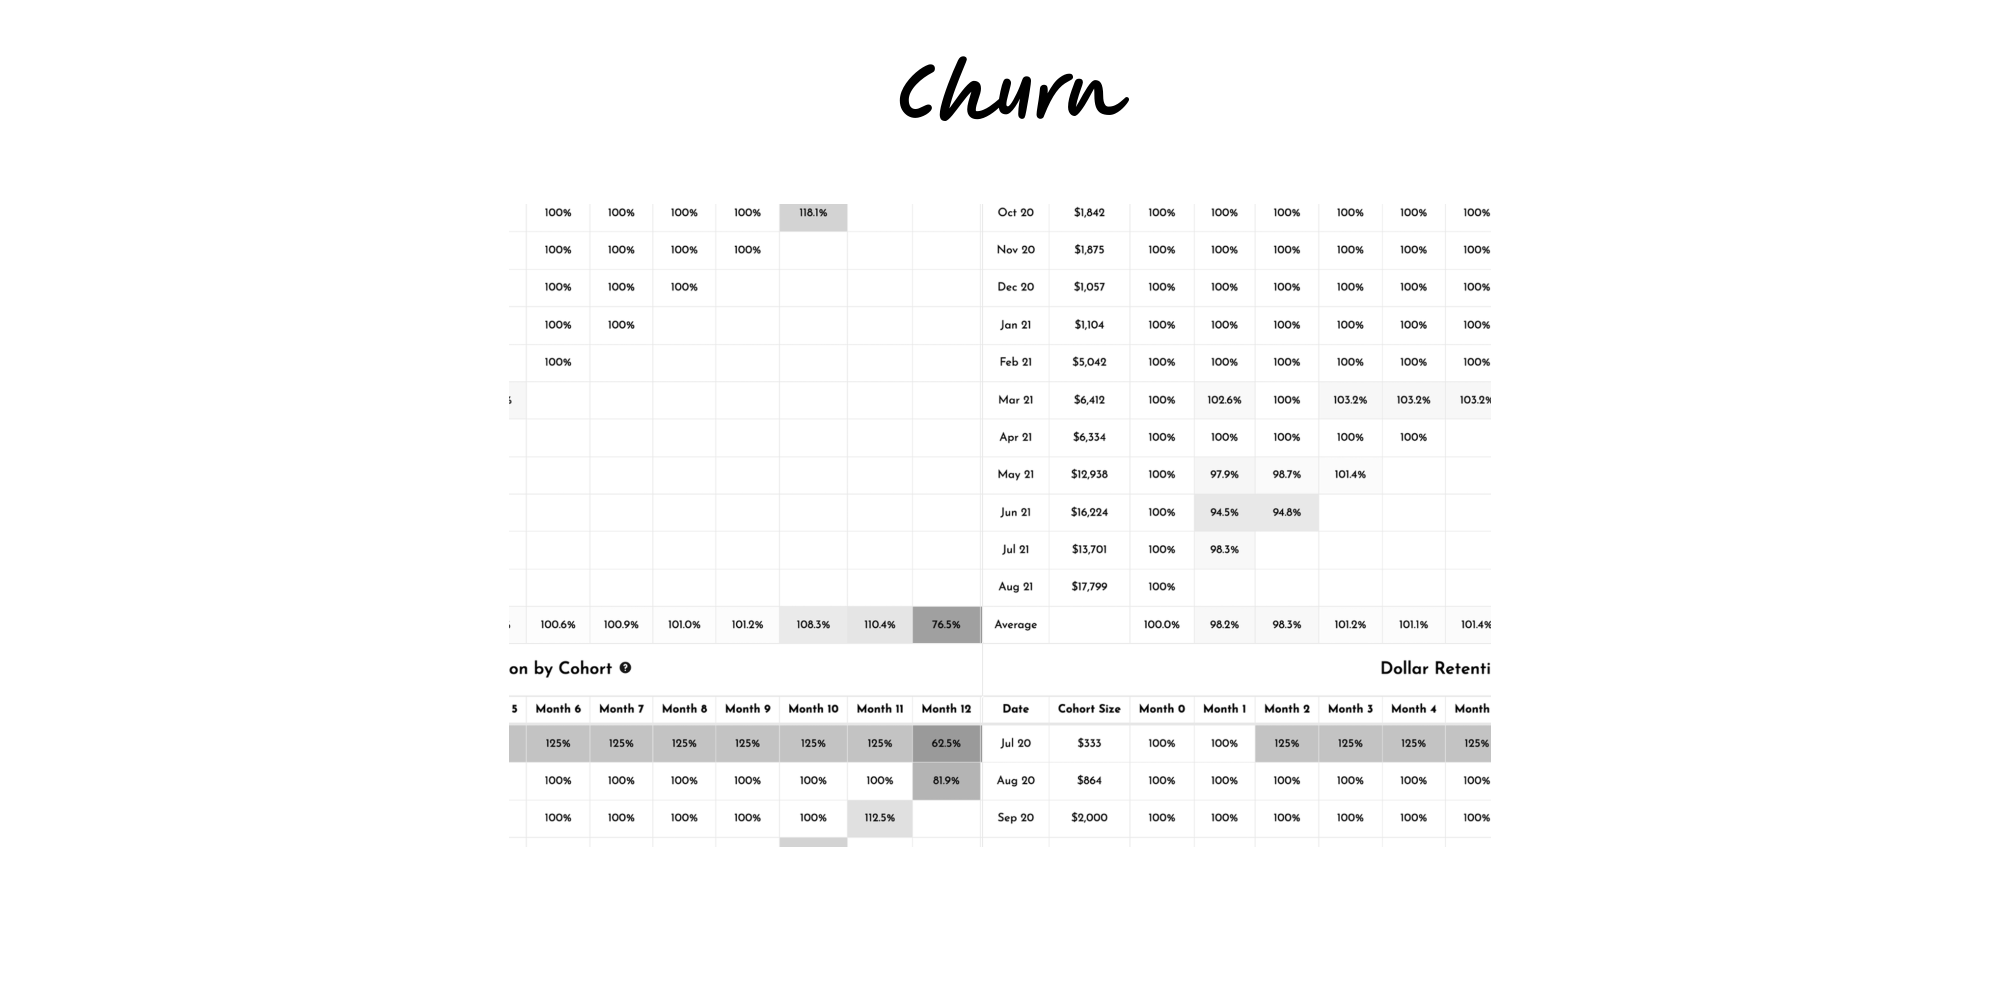
Churn
The rate customers leave.
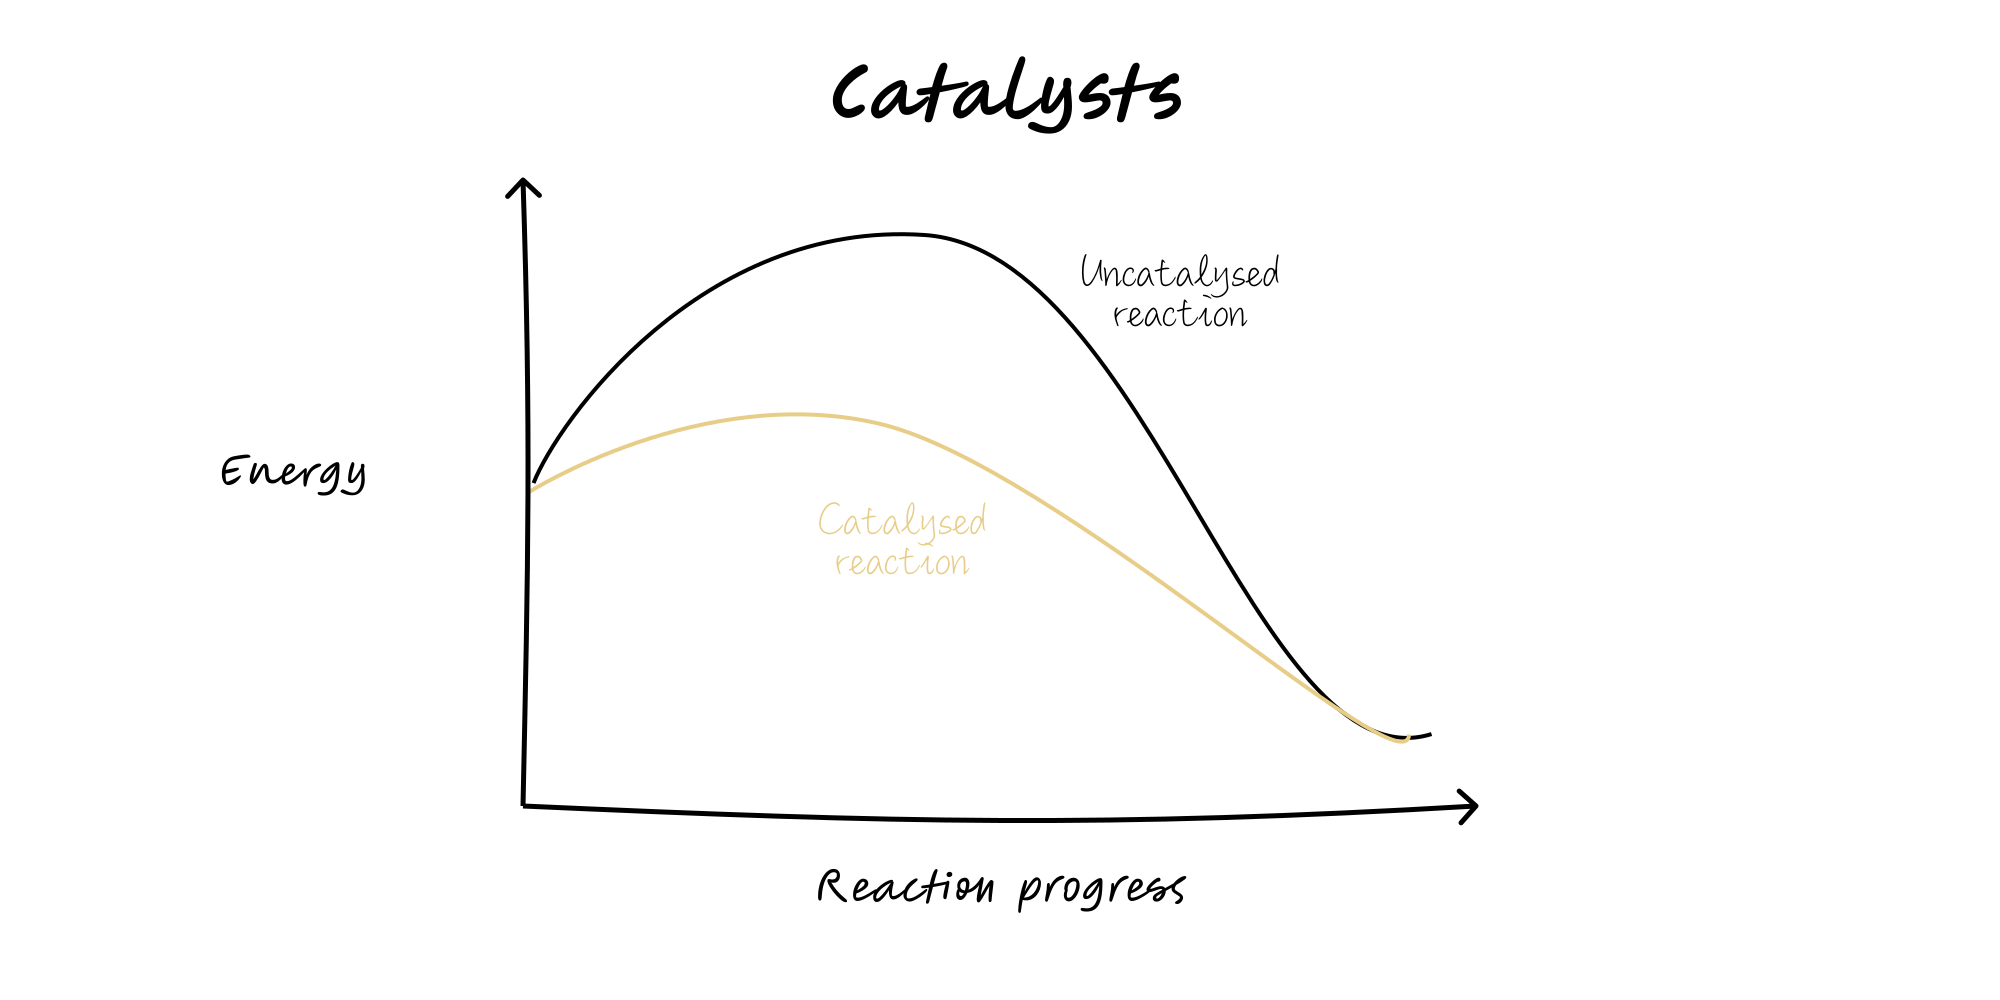
Catalysts
Triggers that accelerate a reaction or strategy without being consumed—partnerships, regulation, or technology shocks.
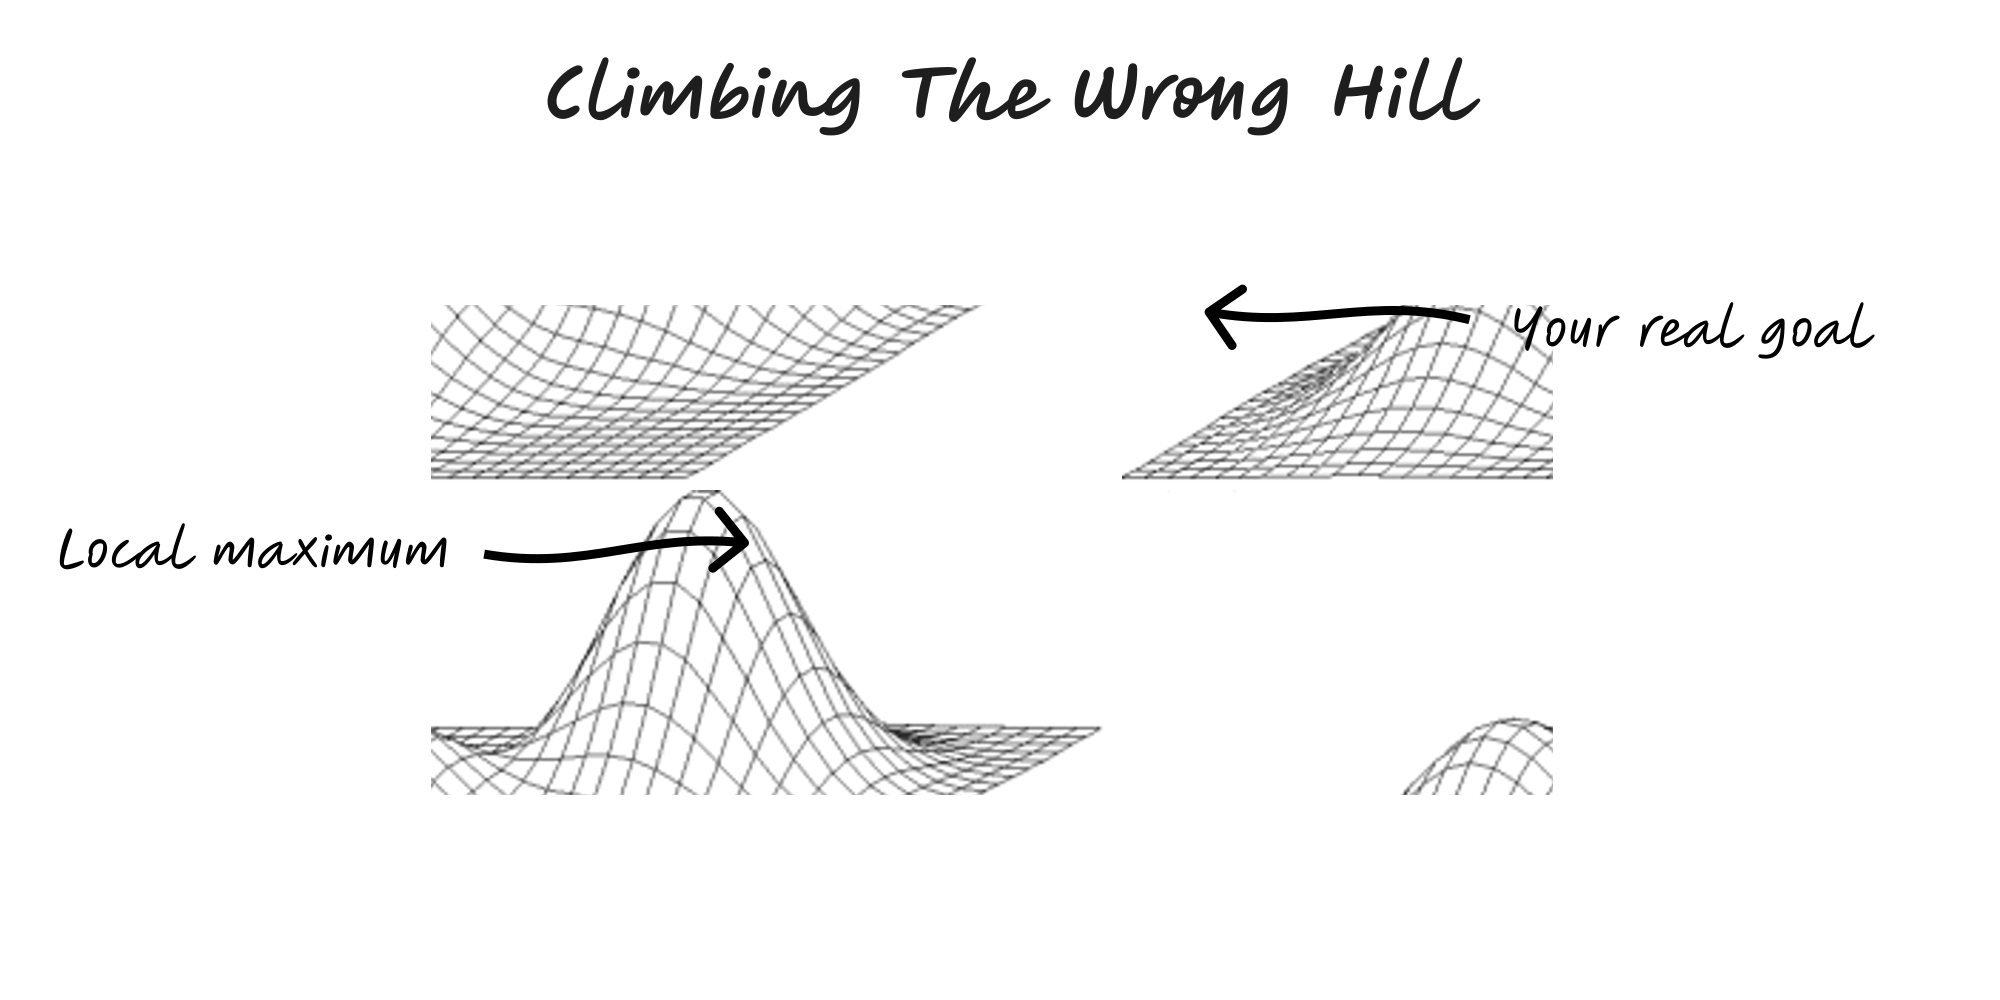
Climbing the Wrong Hill
Greedy improvements can trap you on a nearby peak; sometimes you must go down or sideways to reach a higher hill.
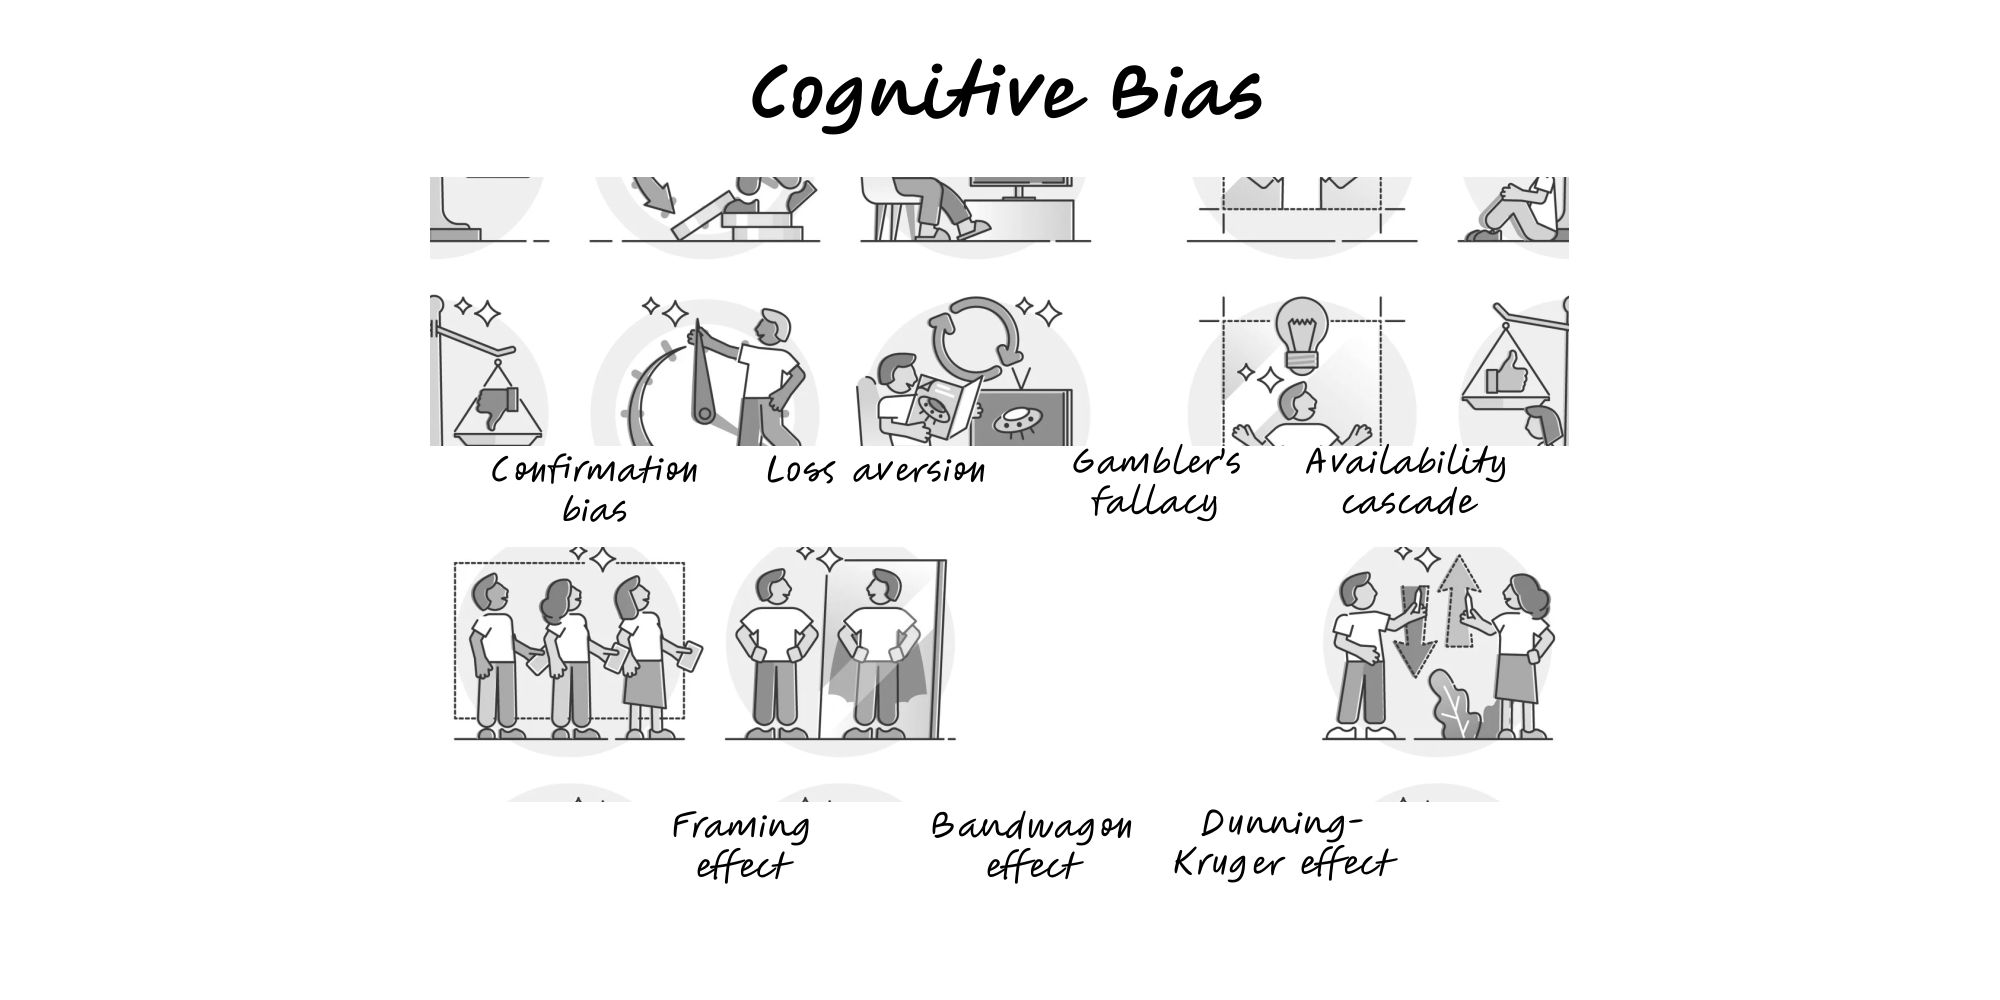
Cognitive Bias
Systematic shortcuts in thinking that create predictable errors. Know the patterns; design decisions and communication to counter their effects.

Breakpoints
Thresholds where behaviour shifts non‑linearly—small pushes create big changes once the system crosses a point.
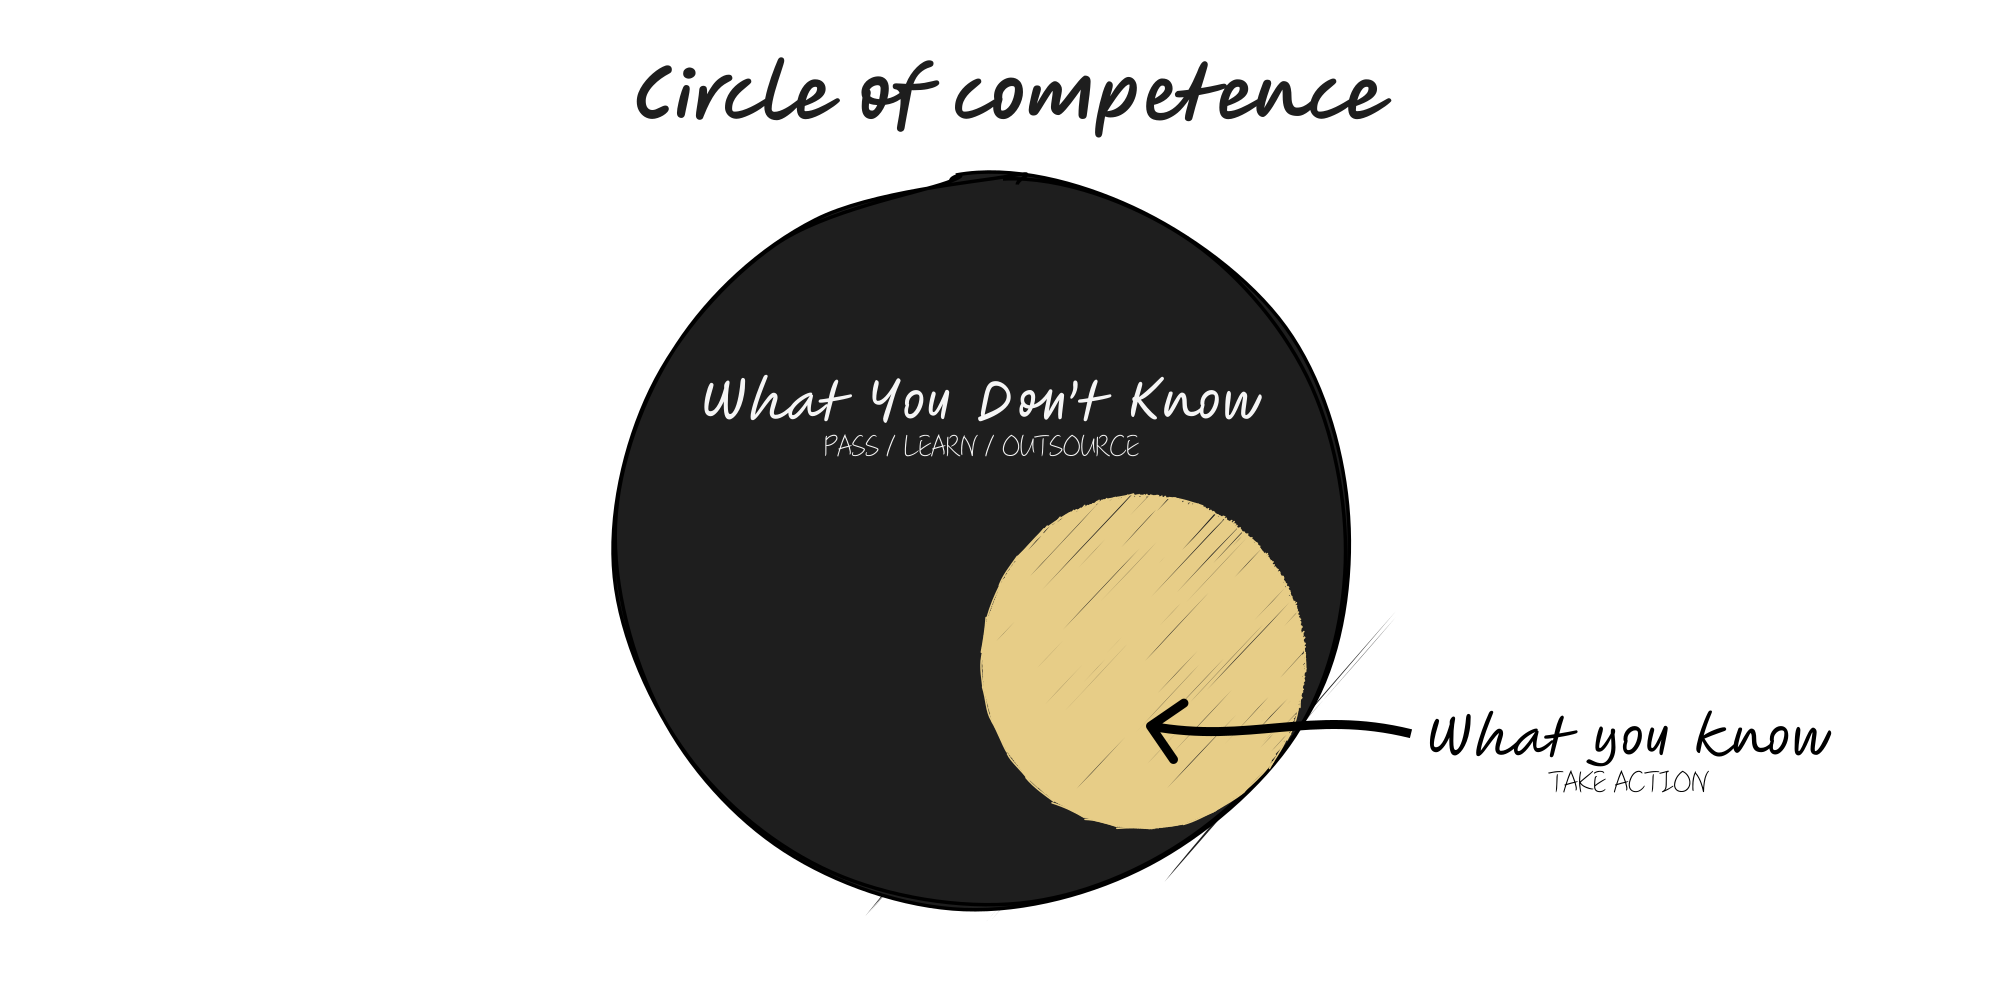
Circle of Competence
Operate where you truly understand cause and effect; stay inside the circle, expand it deliberately, and partner outside it.
The Tragedy of the Commons
Open-access resources are overused because users don’t bear full costs.
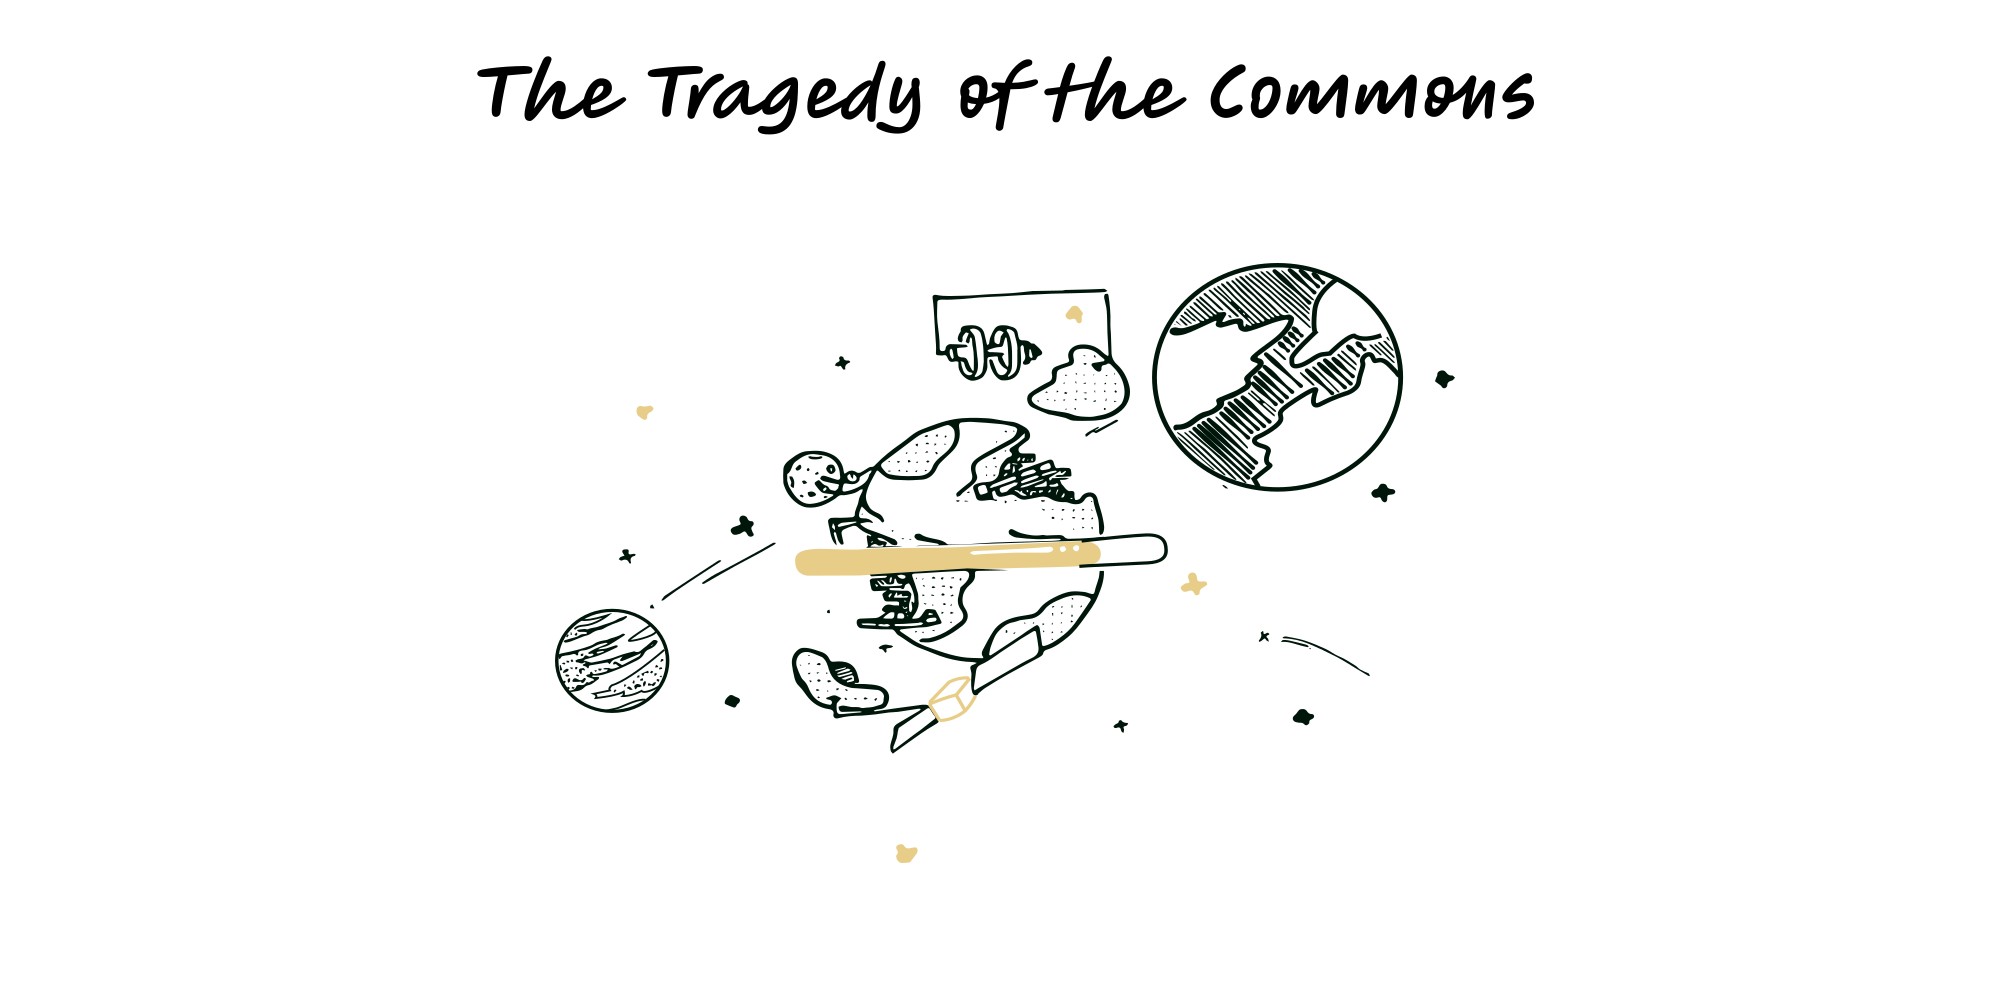
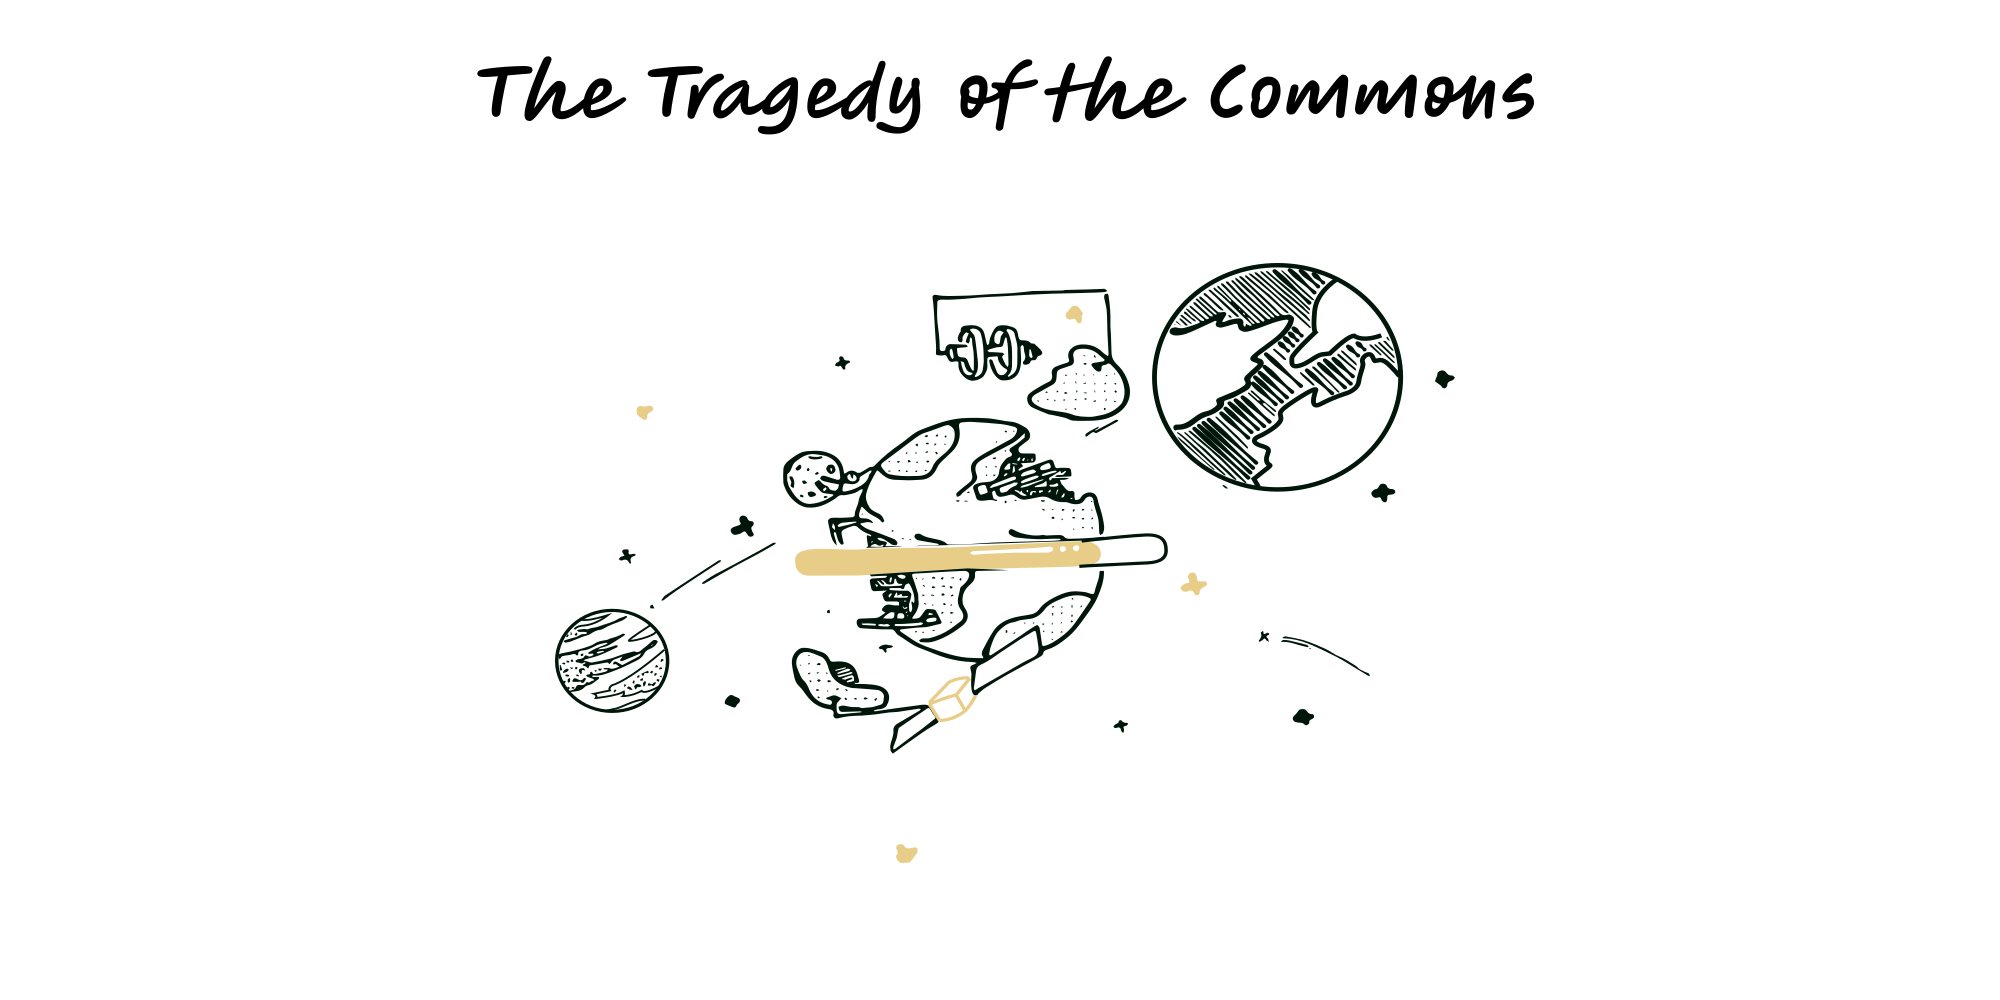
The Tragedy of the Commons
Open-access resources are overused because users don’t bear full costs.
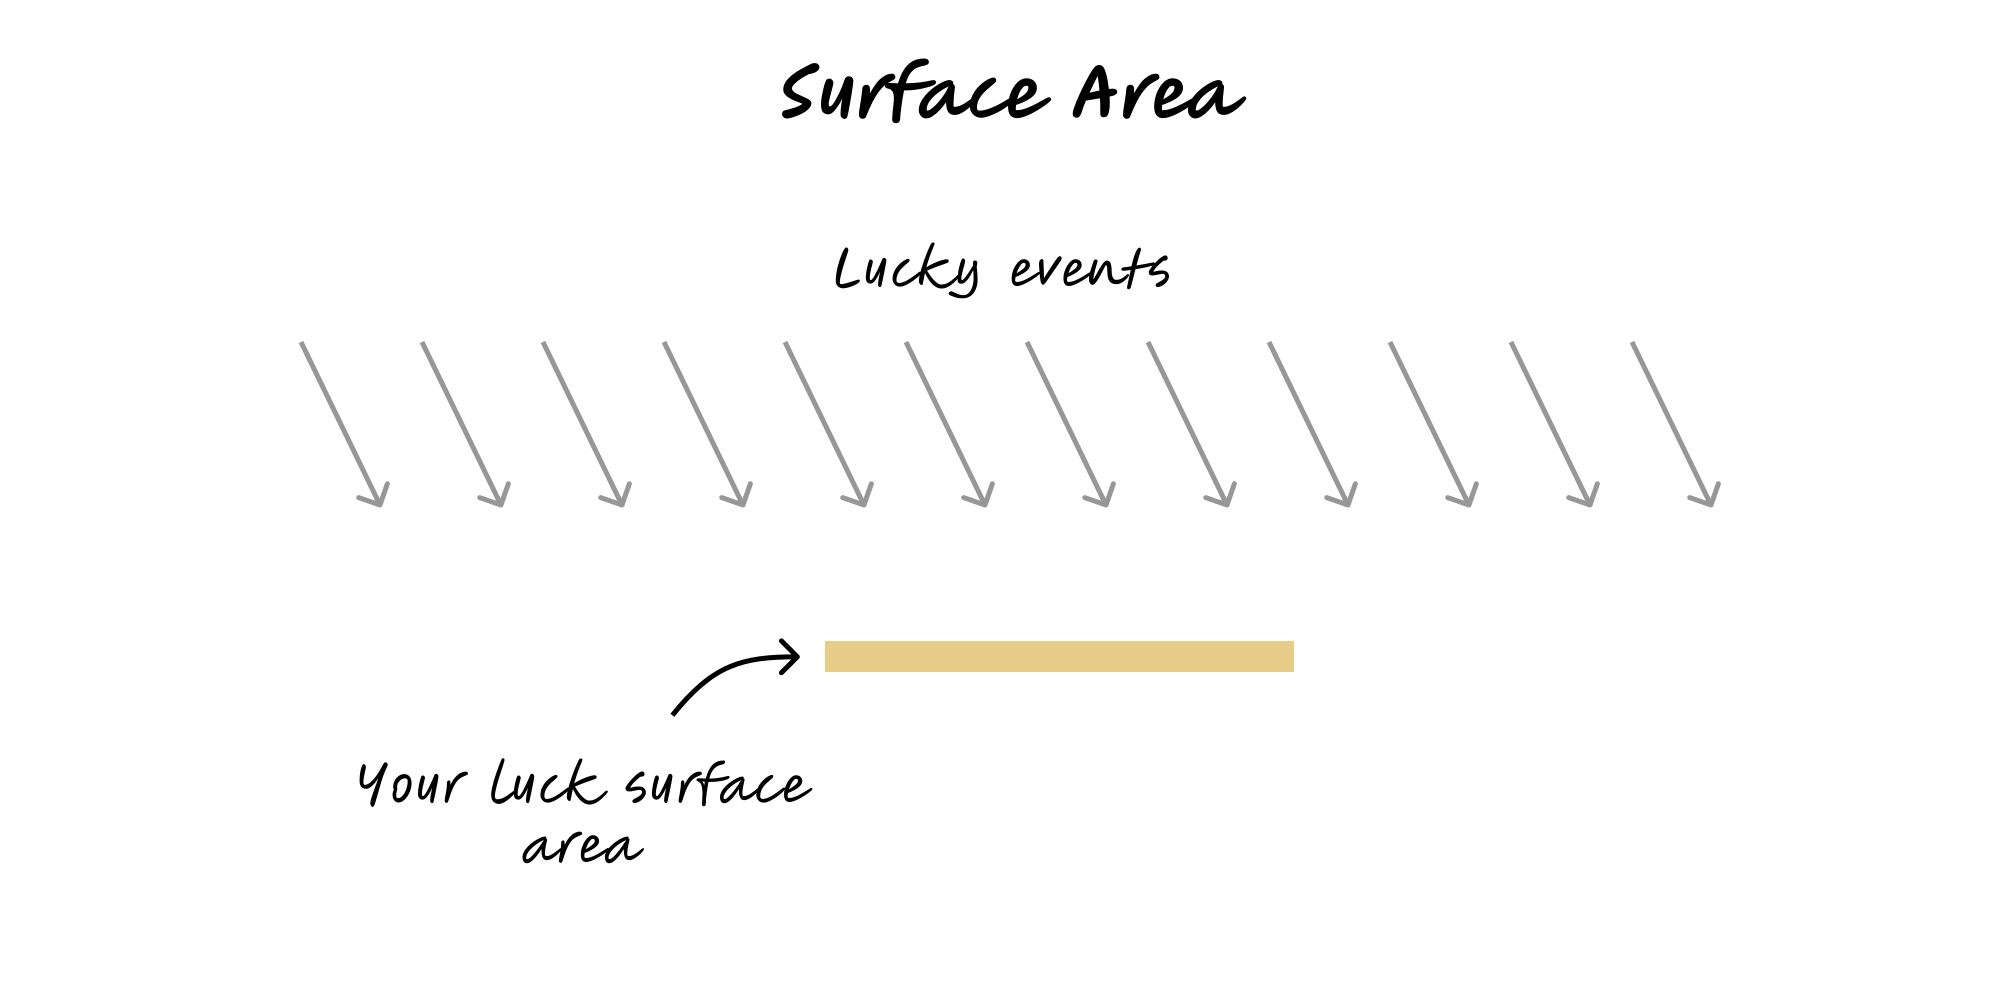
Surface Area
Increase where good things can happen; shrink where bad things can strike.
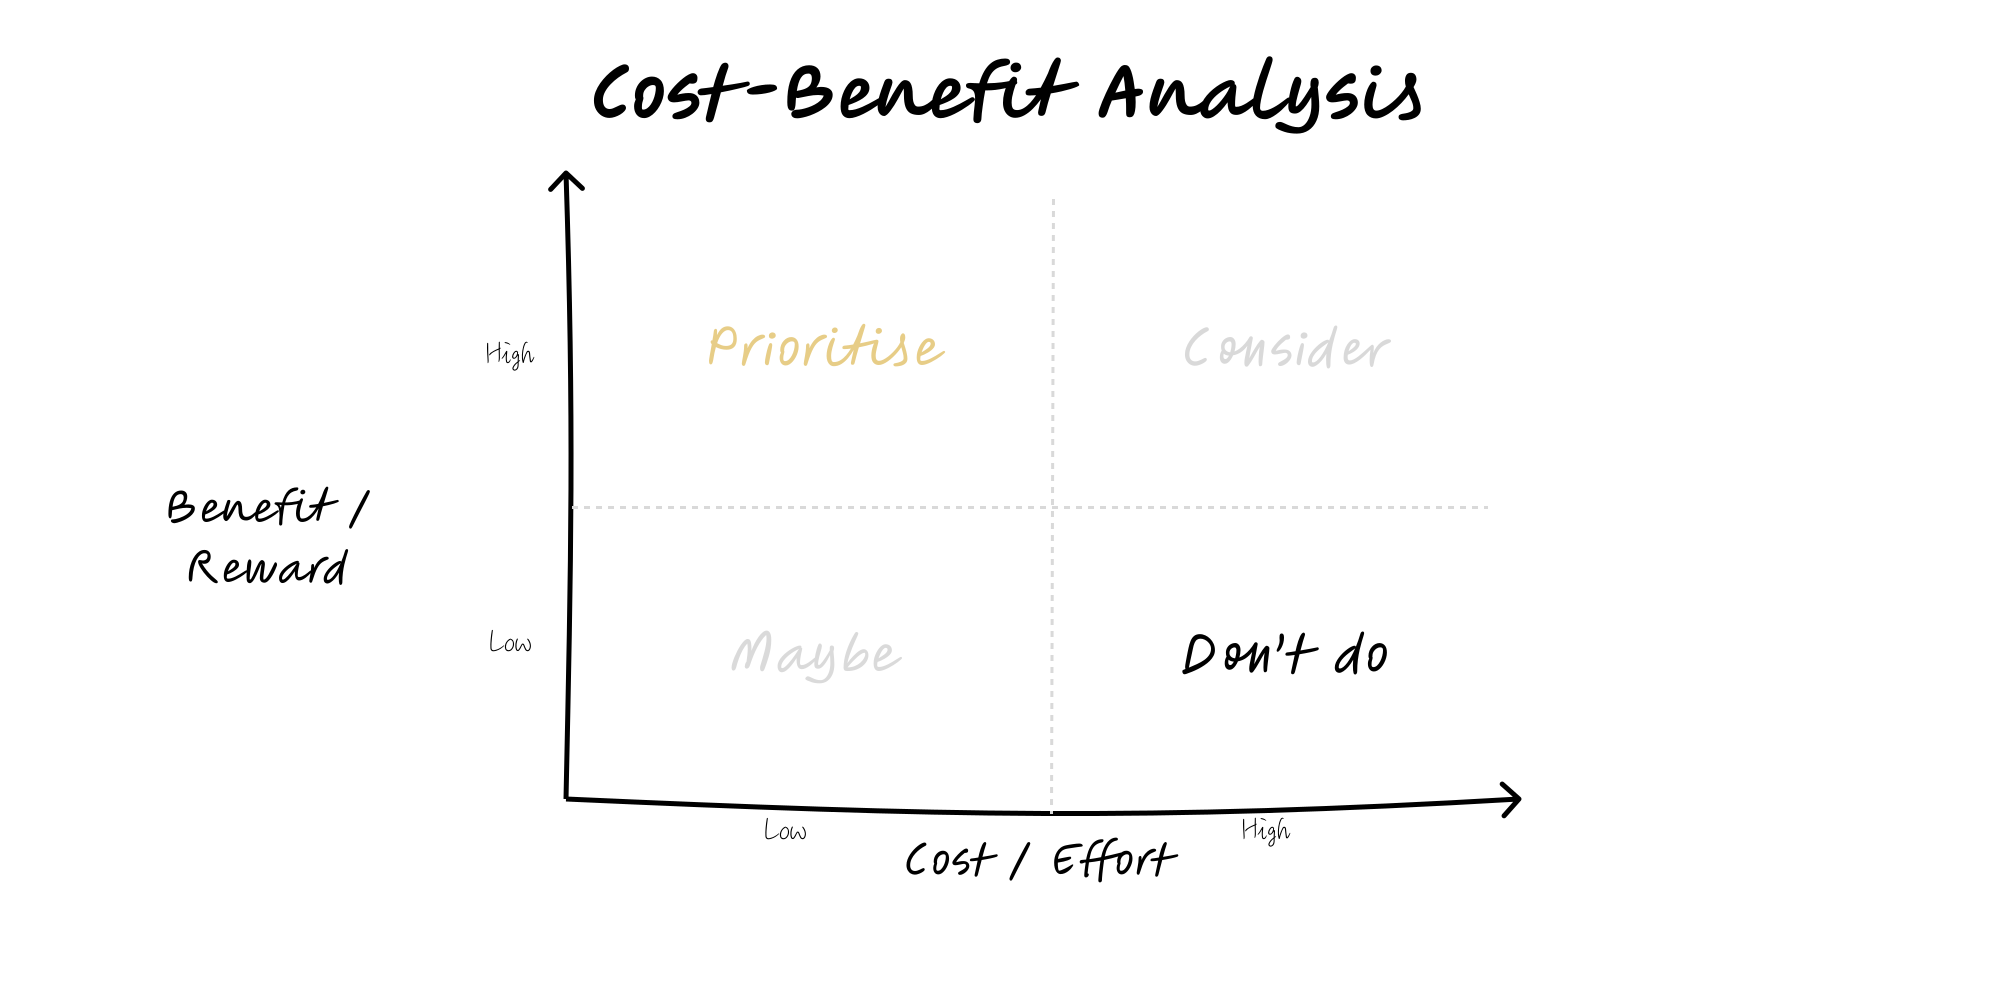
Cost-Benefit Analysis
Plot initiatives by benefit vs cost to spot quick wins, staged bets and time-sinks.
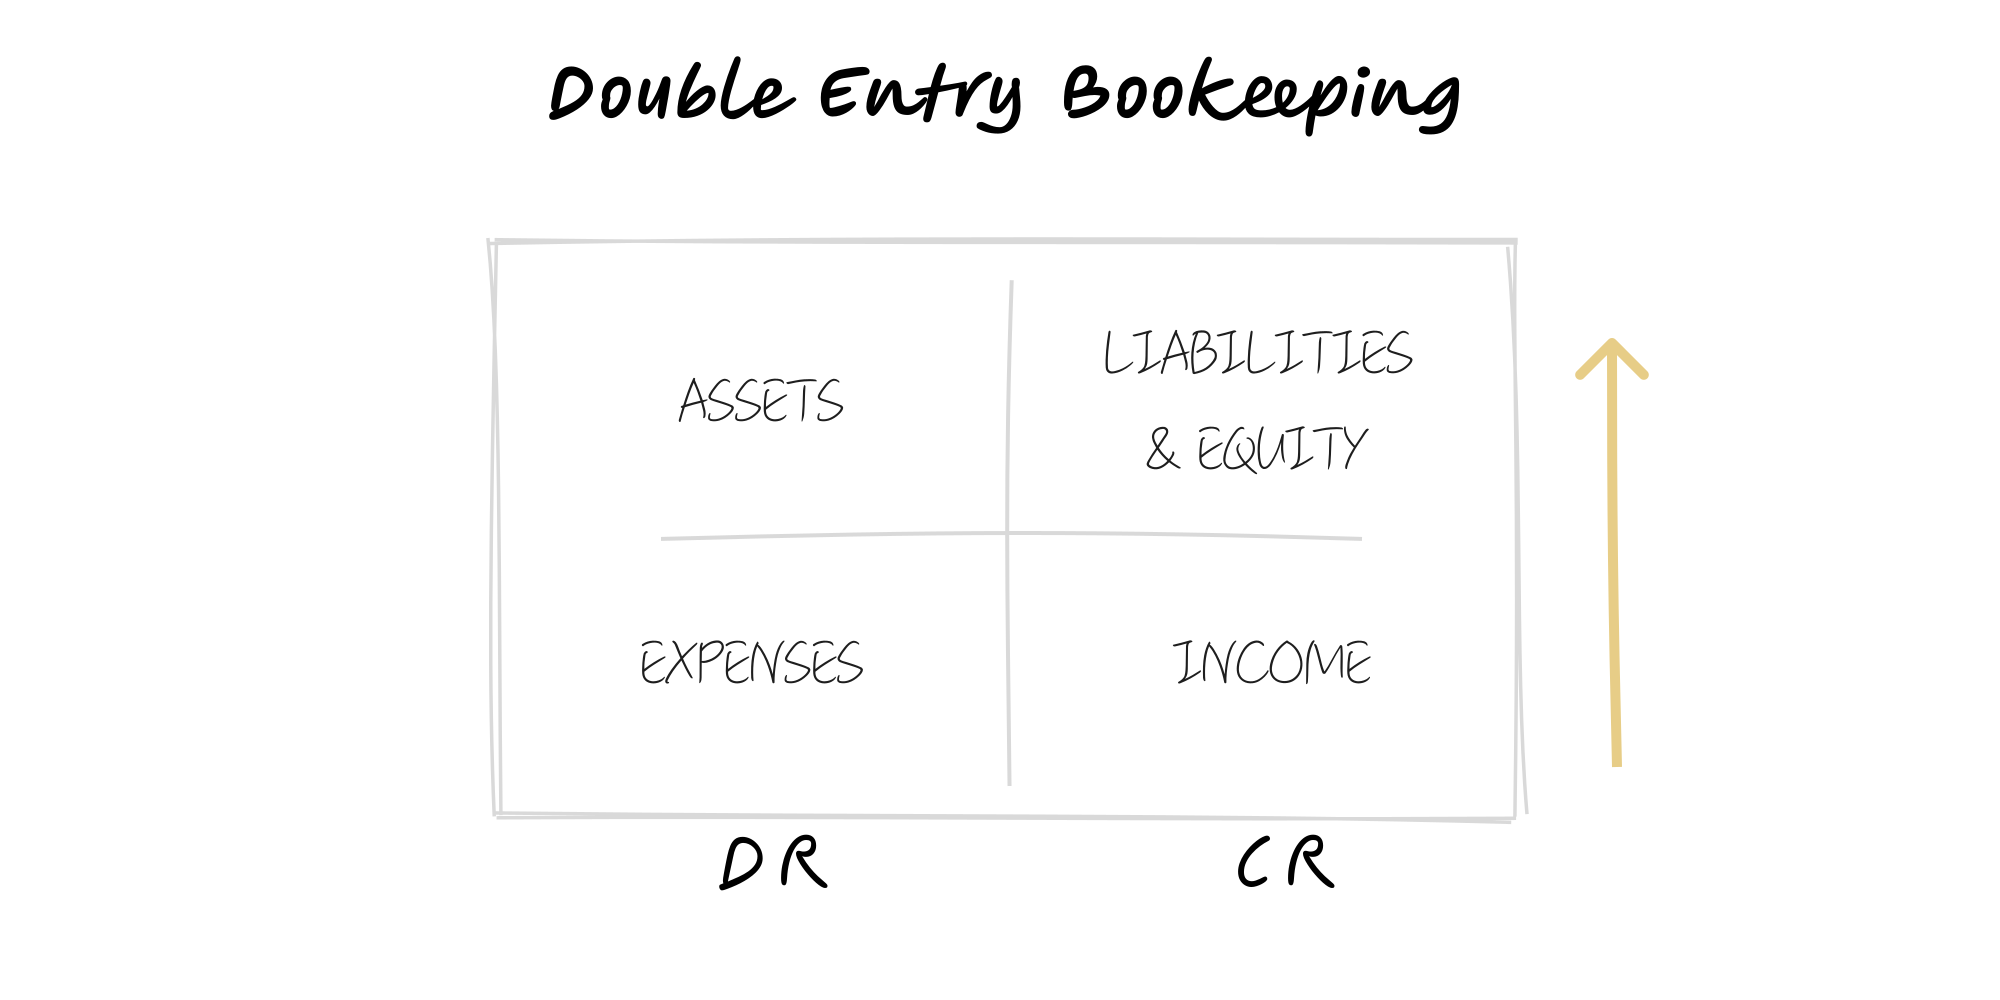
Double-Entry Bookkeeping
Every transaction records equal debits and credits; ensures the books balance and errors surface.
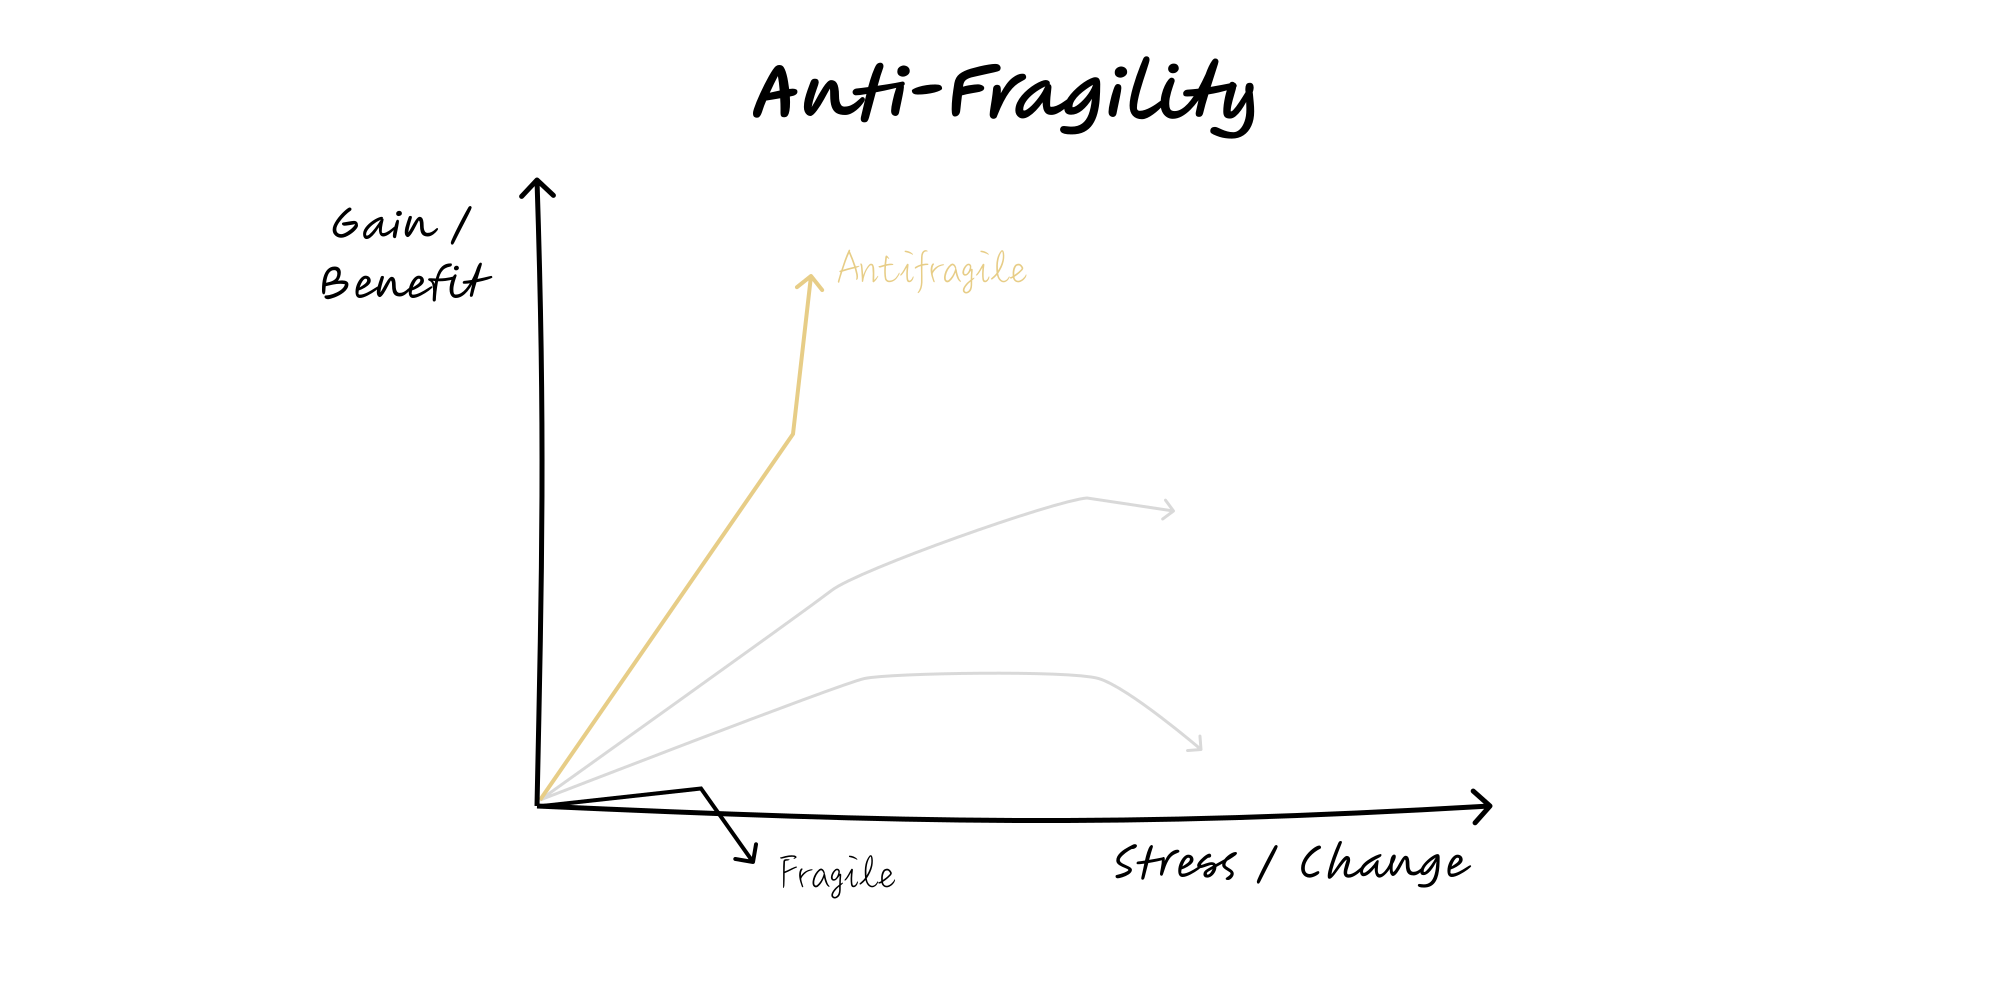
Anti-Fragility
Design systems that gain from volatility and shocks, not just survive them.
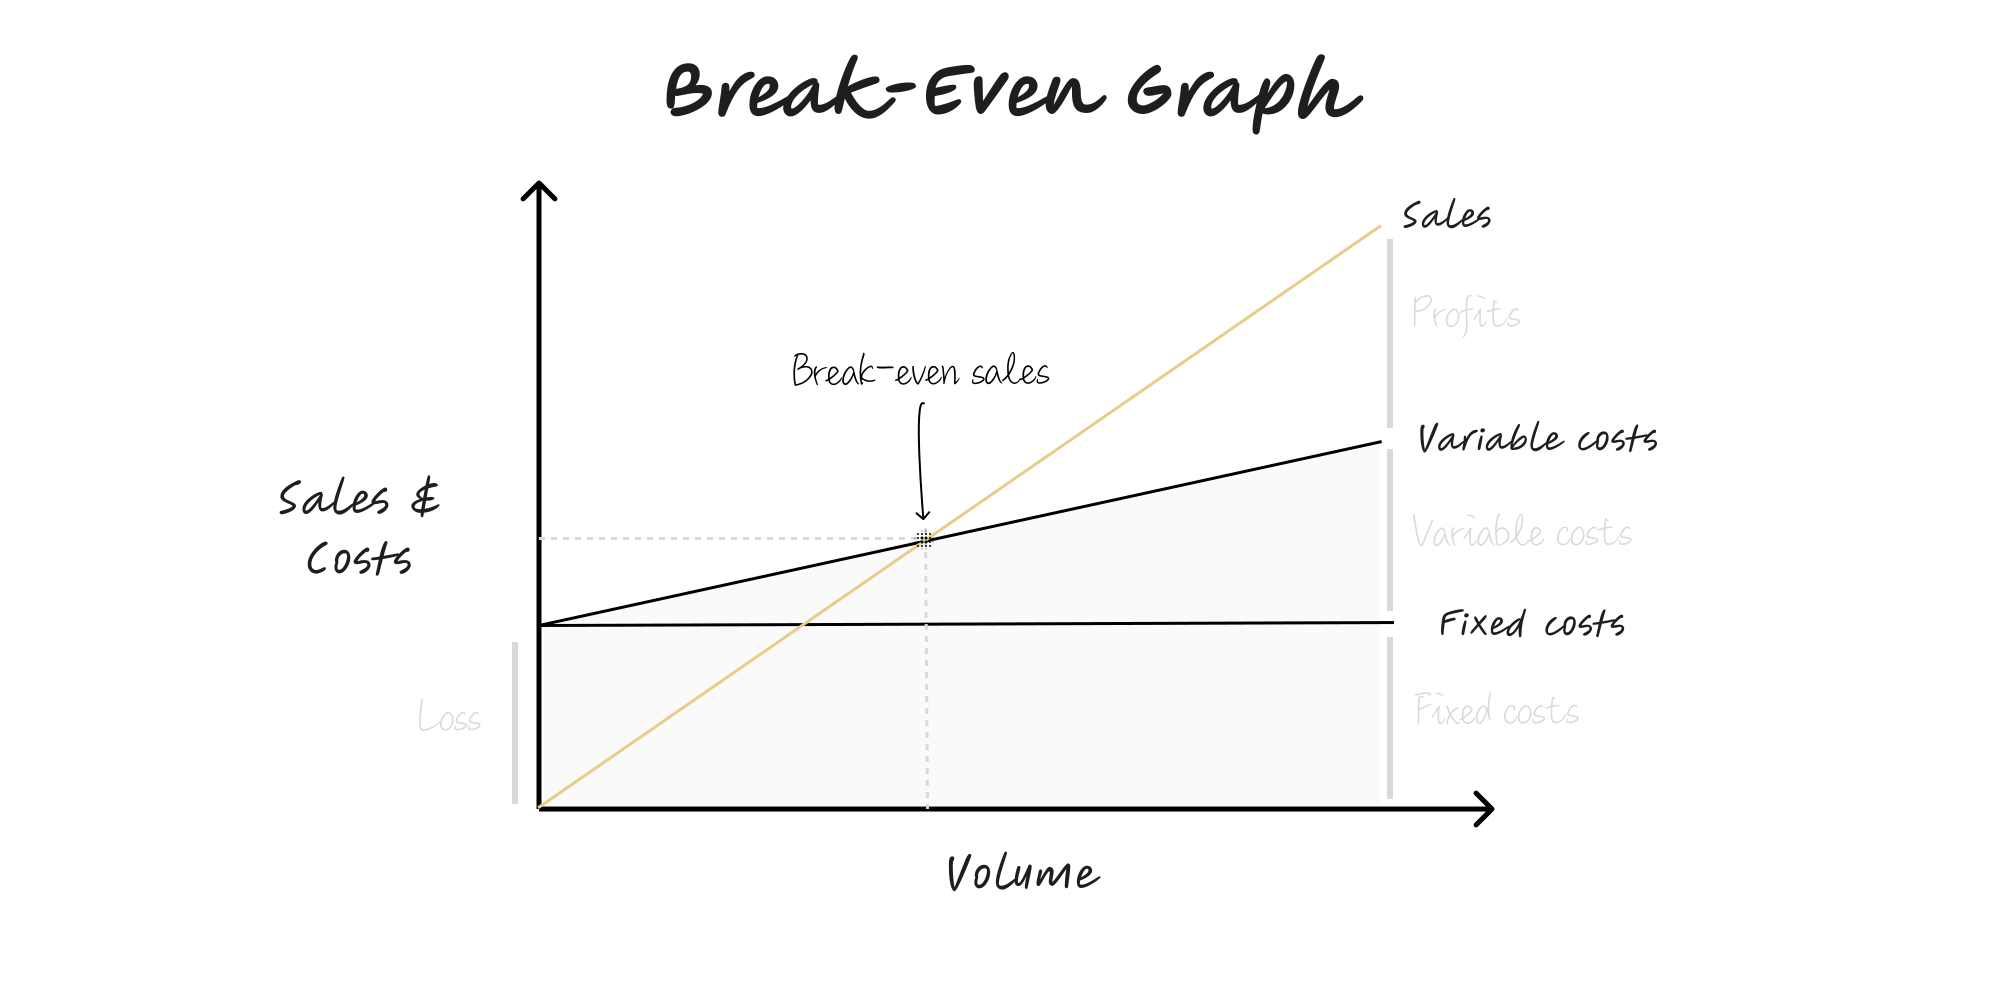
Break-Even Graph
Visualises the volume at which revenue equals total cost; clarifies pricing, fixed vs variable costs, and margin of safety.
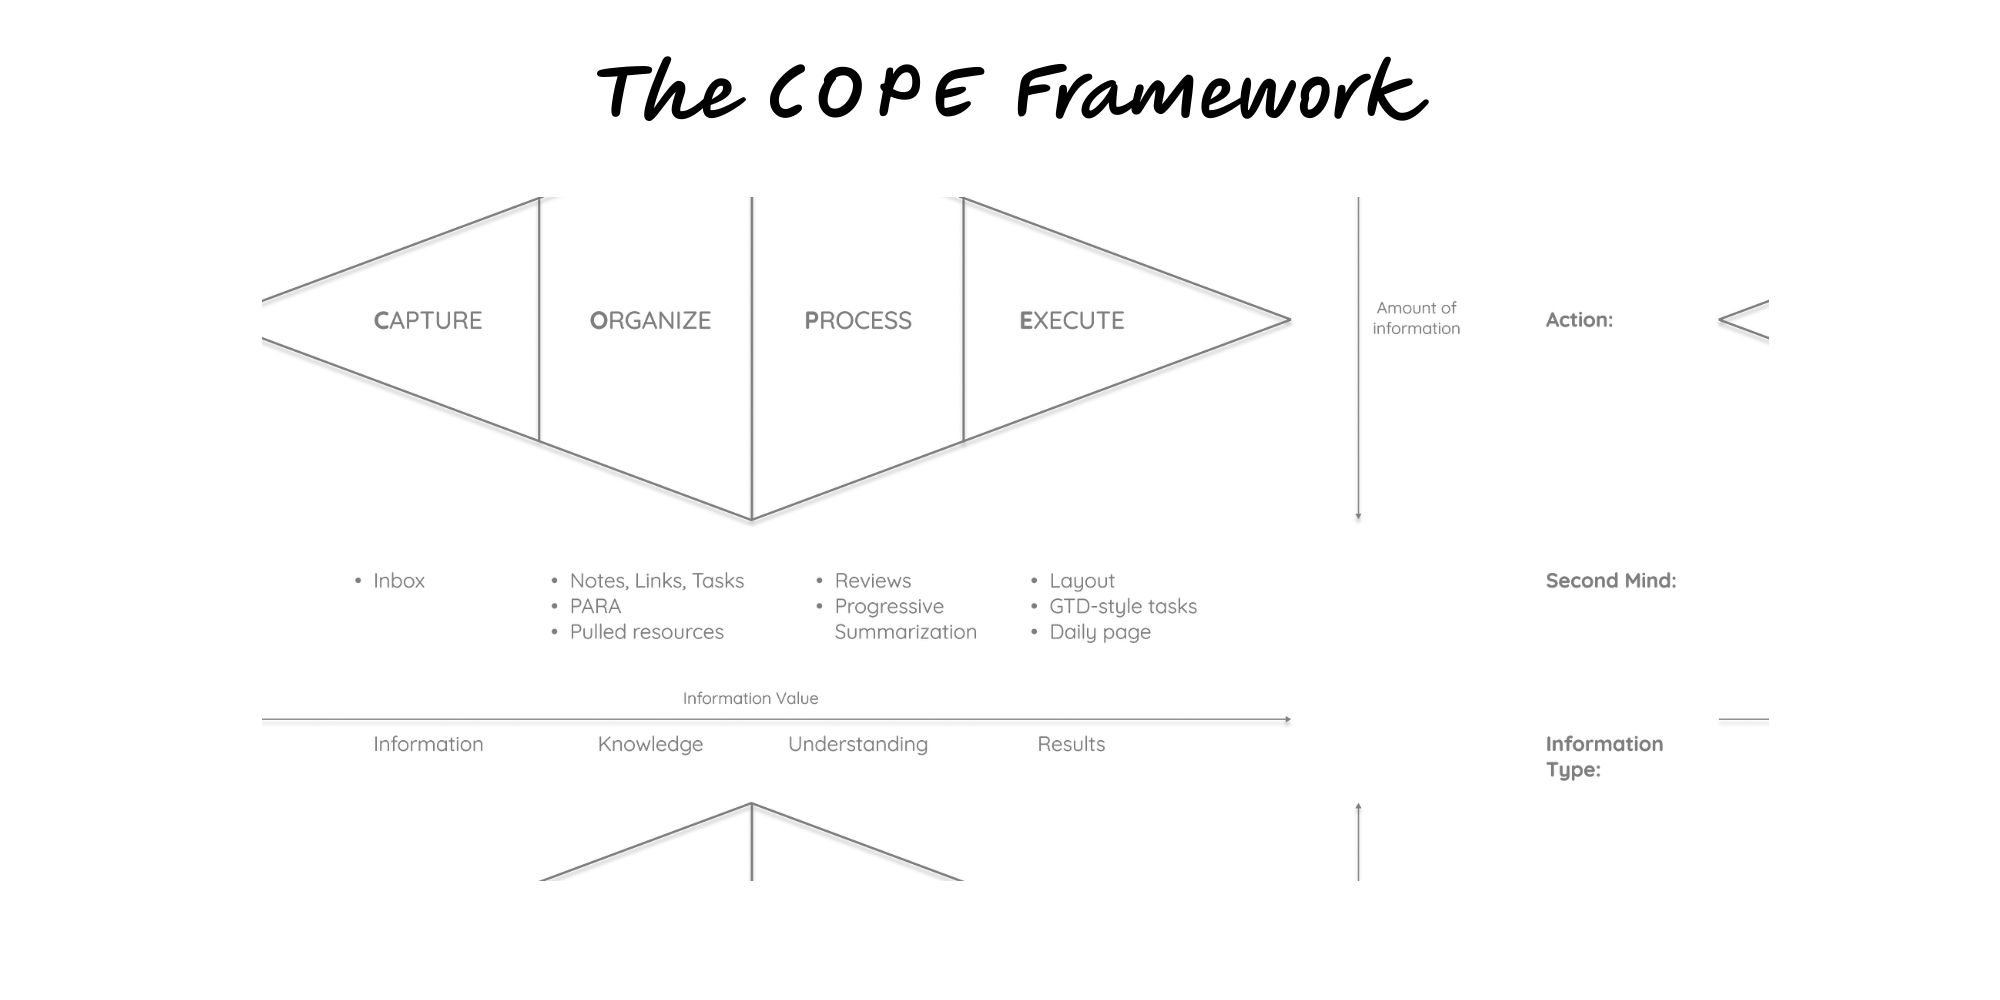
COPE Framework
Create once, publish everywhere by structuring content and separating it from presentation so one source feeds many channels.
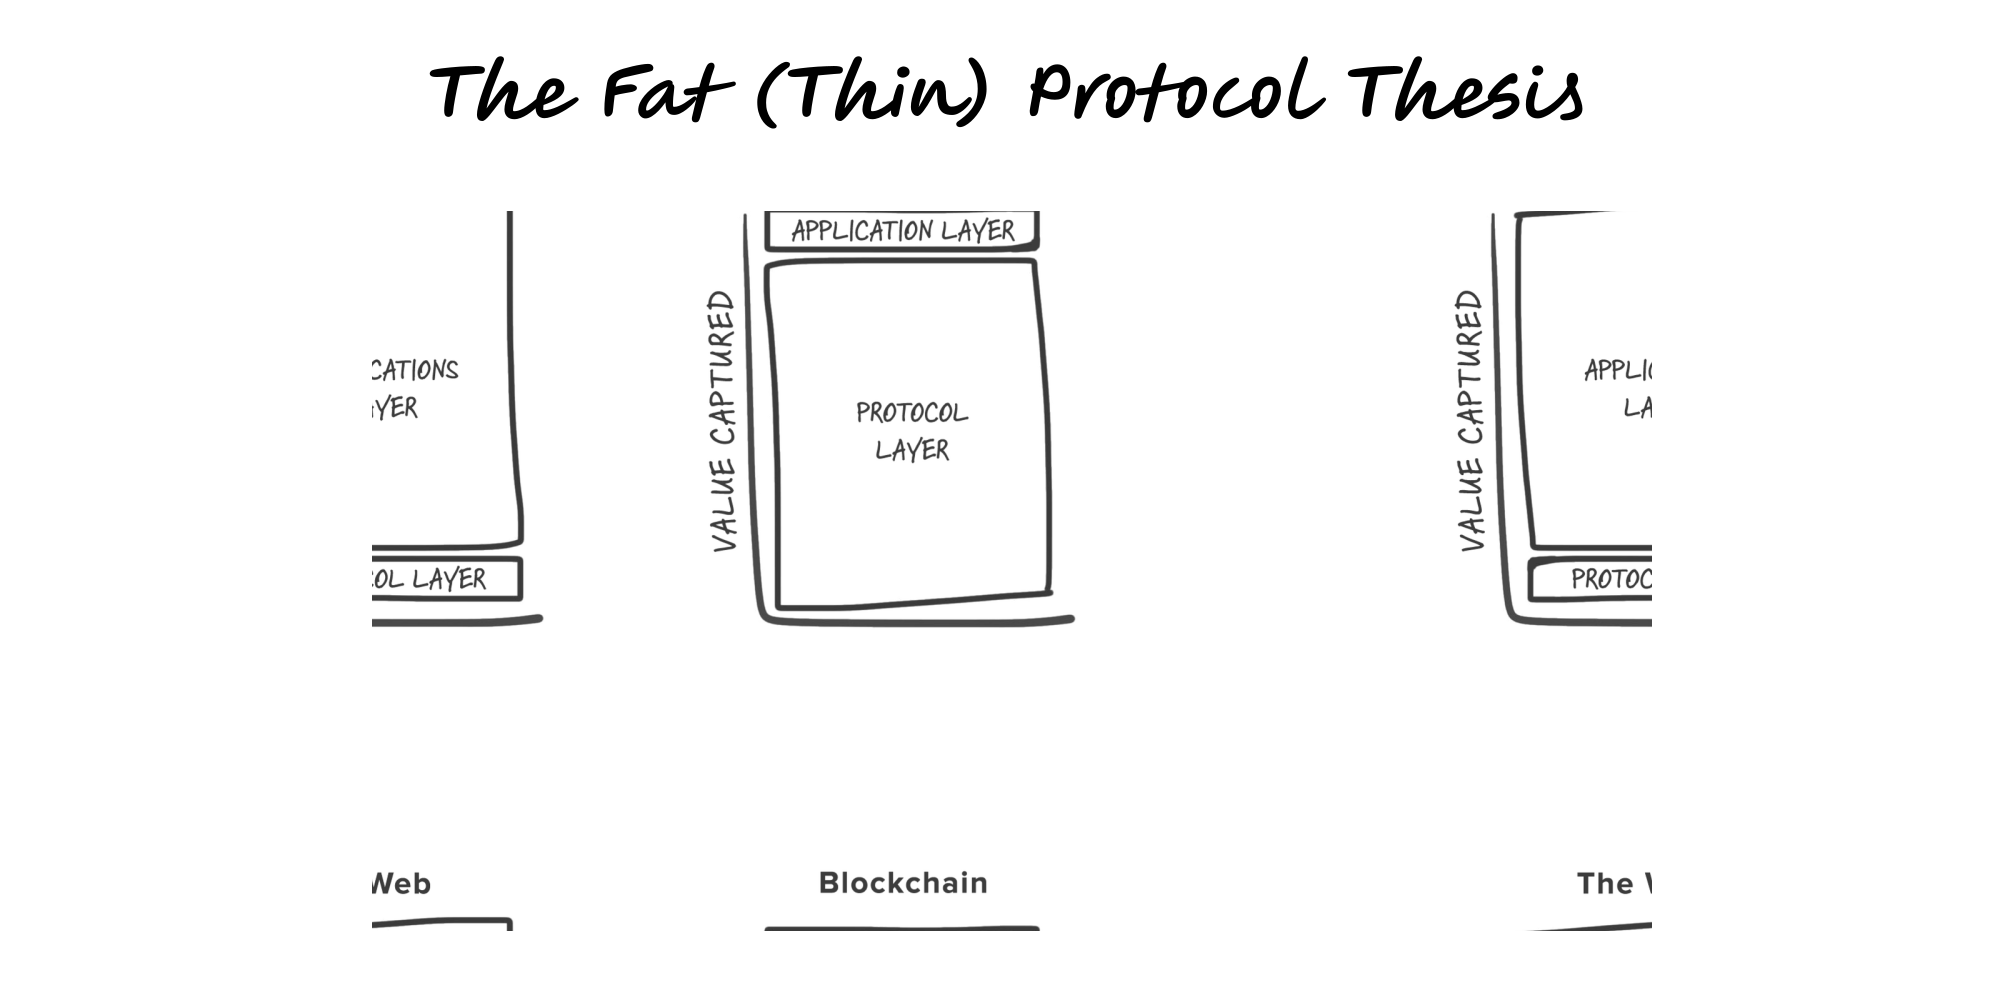
Fat Protocol Thesis
In blockchains, value tends to concentrate at the shared protocol layer rather than the application layer, though modular stacks and wallets can shift where value accrues.
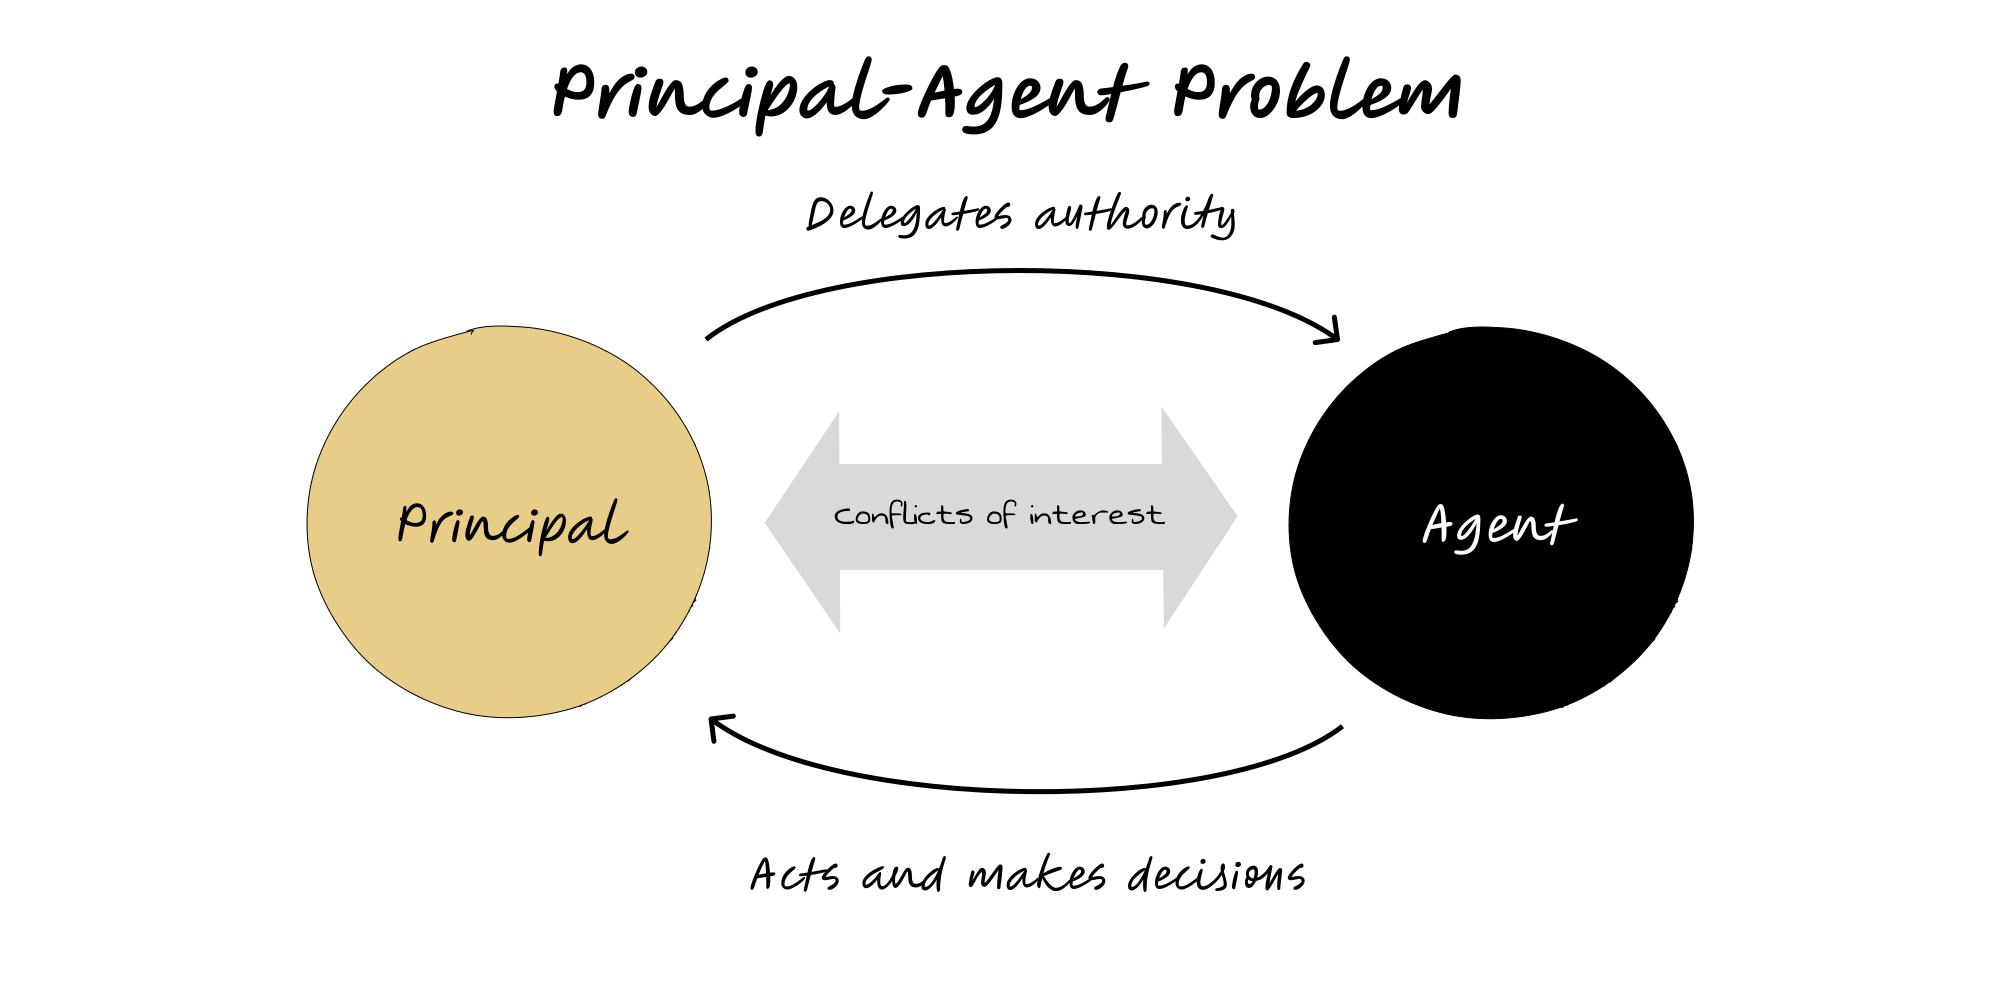
Principal-Agent Problem
When decision rights are delegated, agents optimise their own payoff under information asymmetry. Without smart contracts and governance, effort, risk and horizon drift away from the principal’s goals.
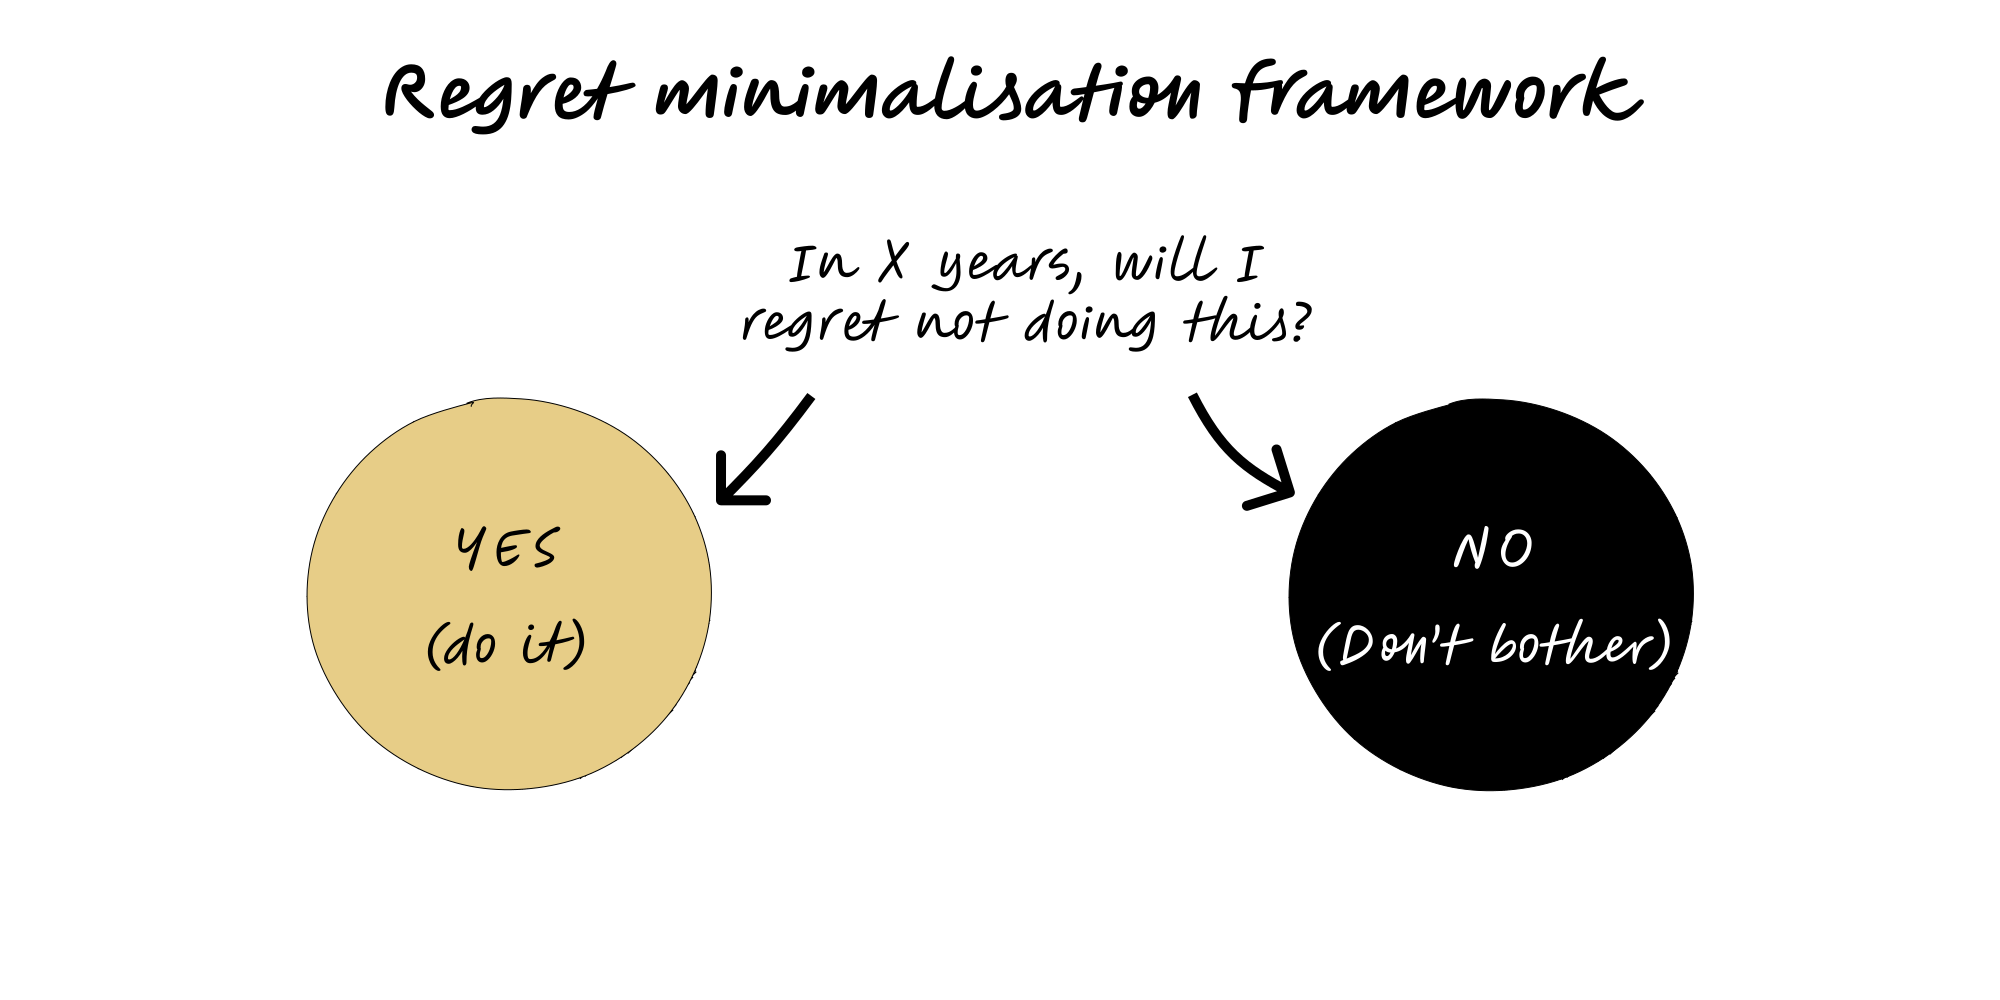
Regret Minimalisation Framework
Project yourself to the decision horizon and choose the option that you will regret least. Weight omissions heavily, and treat reversibility as a key lever.
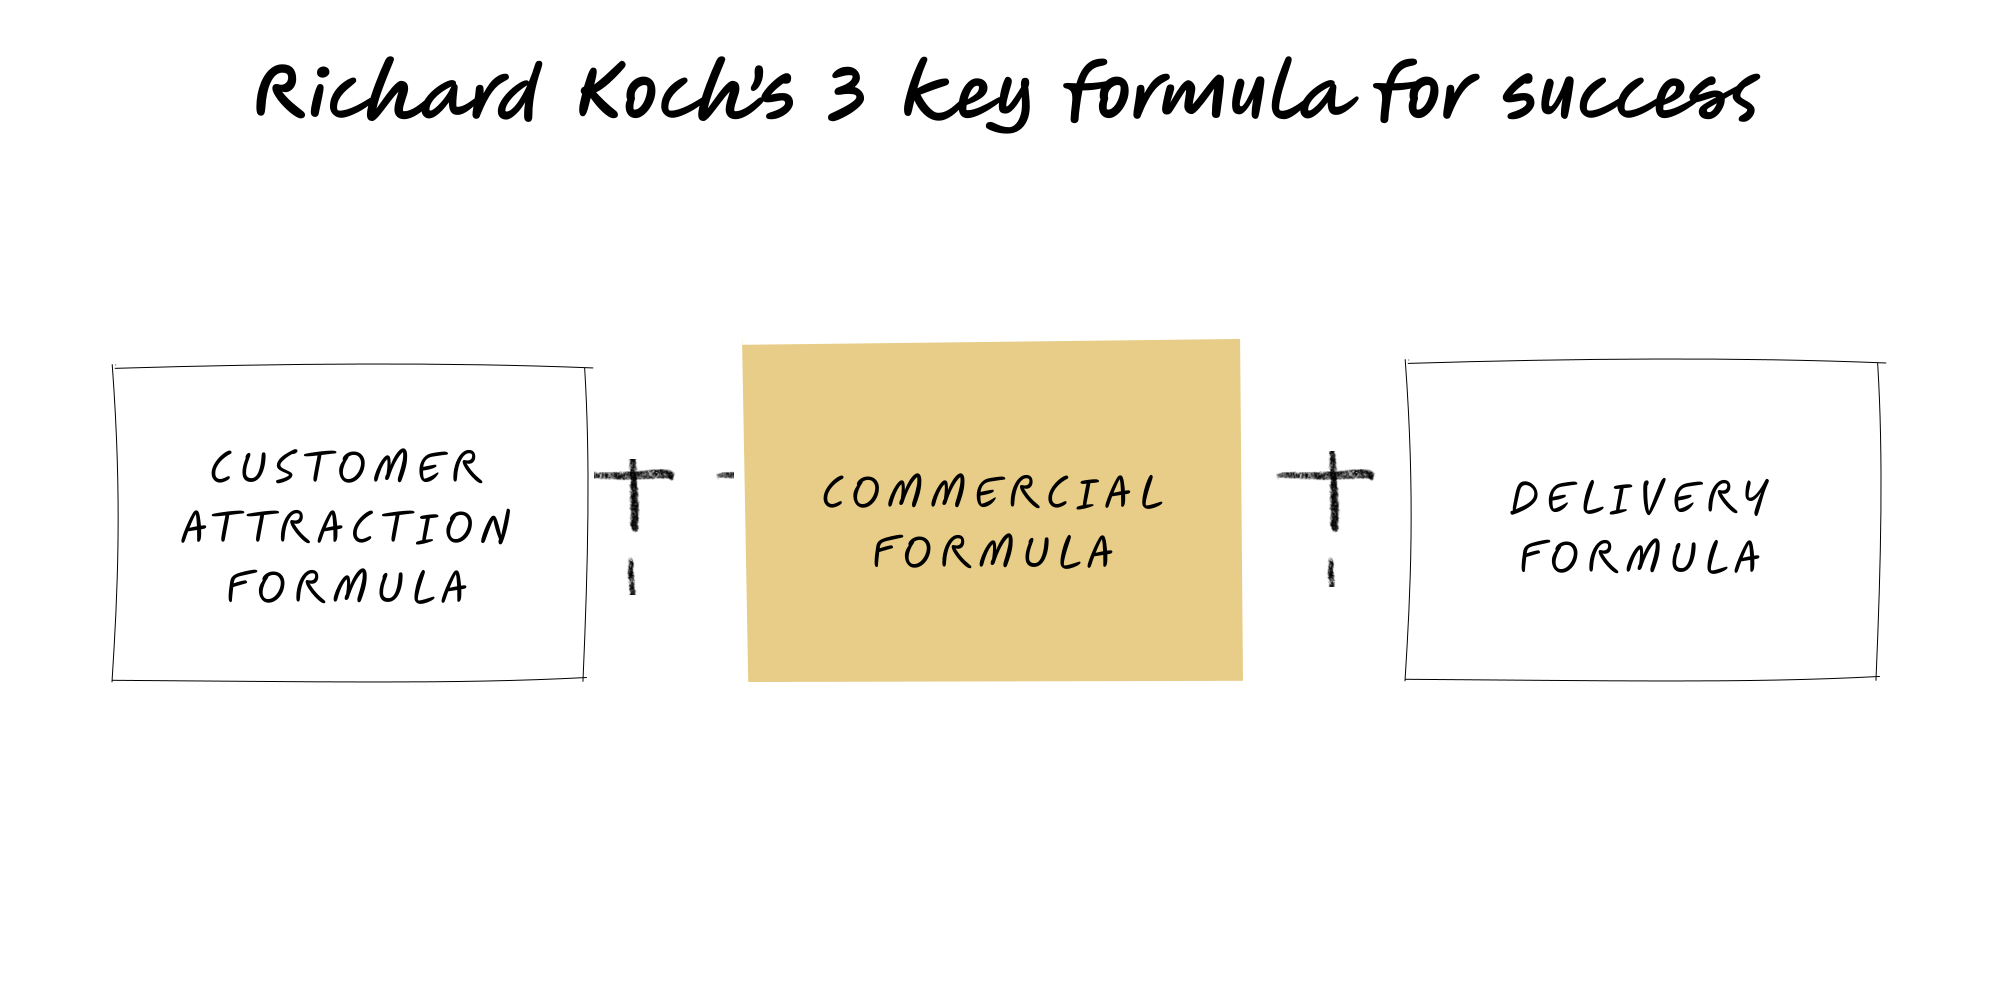
Richard Koch’s 3 Key Formulas
Koch argues that breakout ventures operationalise three repeatable formulas: a Customer Attraction engine, a Delivery machine, and a Commercial formula that locks in fat margins. (He also describes a fourth, Innovation, as an optional accelerator.)  
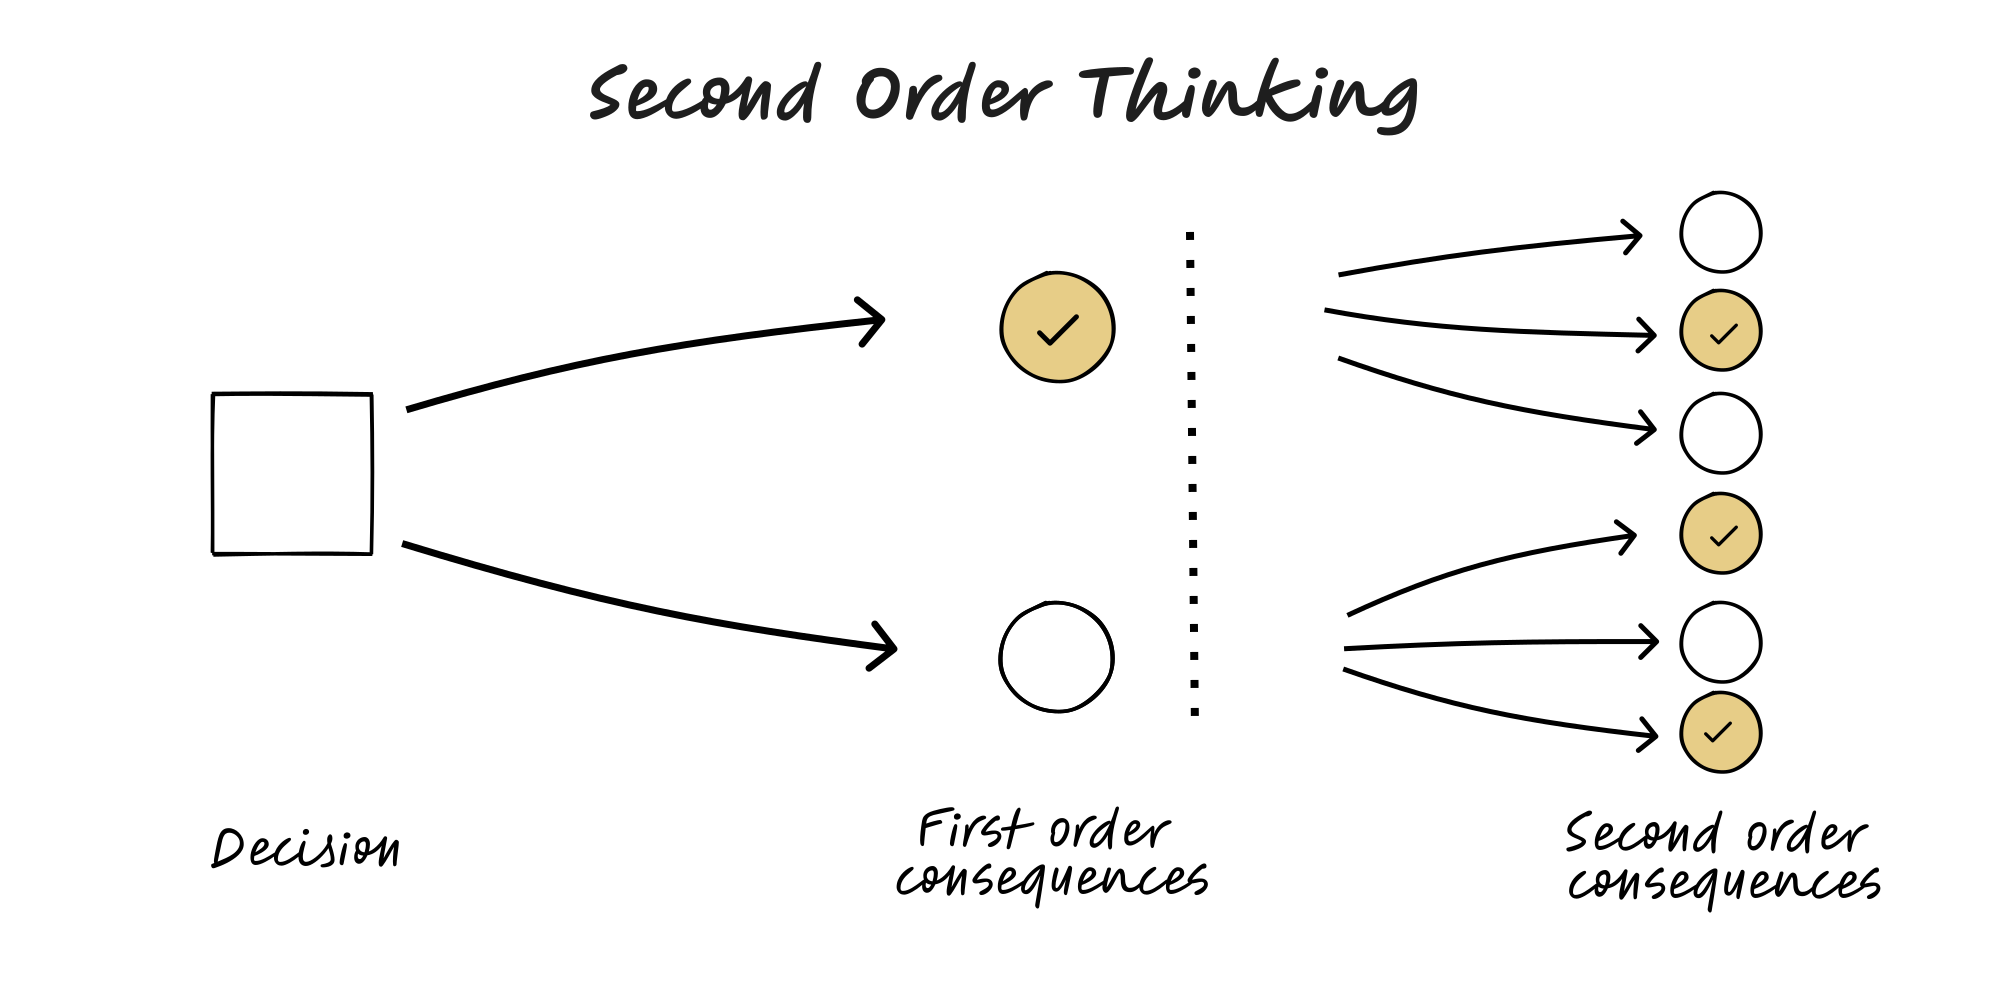
Second Order Thinking
Consider the long-term and indirect consequences of decisions, rather than just the immediate or obvious ones.
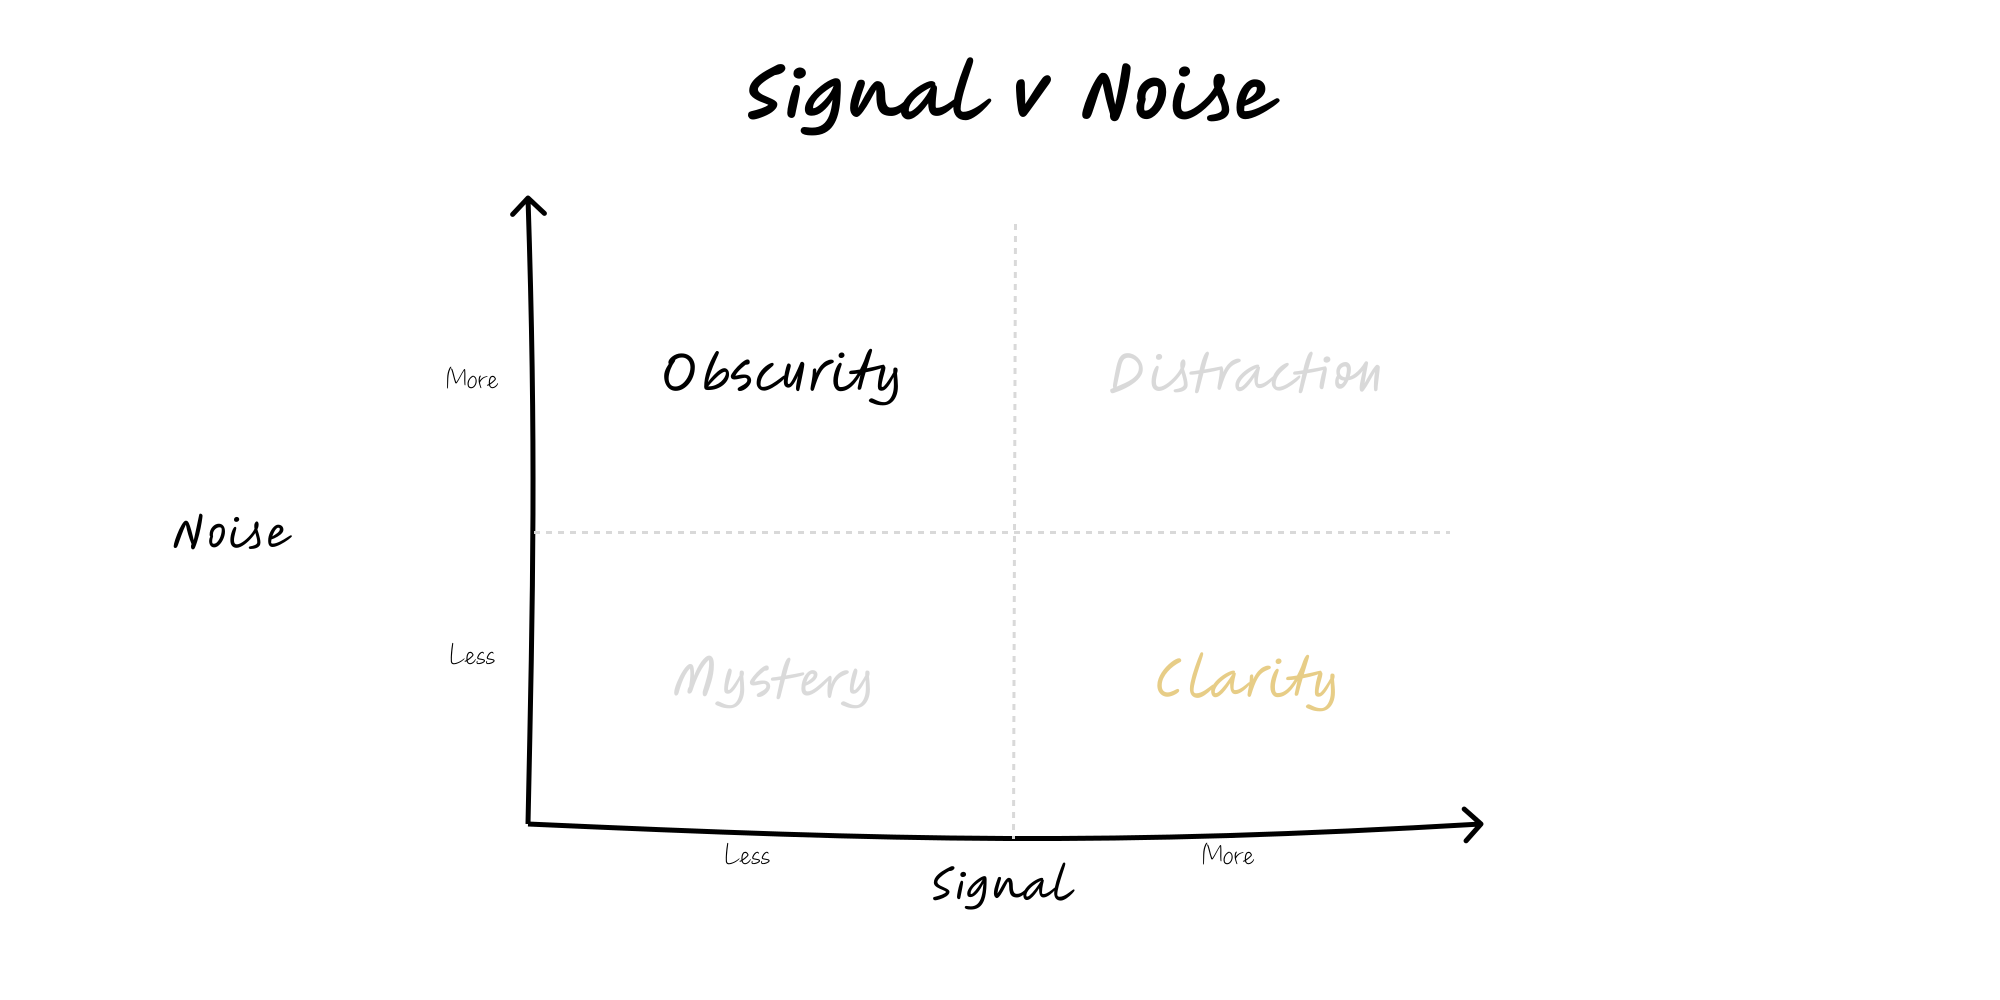
Signal versus Noise
Distinguish meaningful information from random fluctuation. Set thresholds and smoothing to avoid reacting to noise, and act only when movements clear expected variability.
Supply and Demand
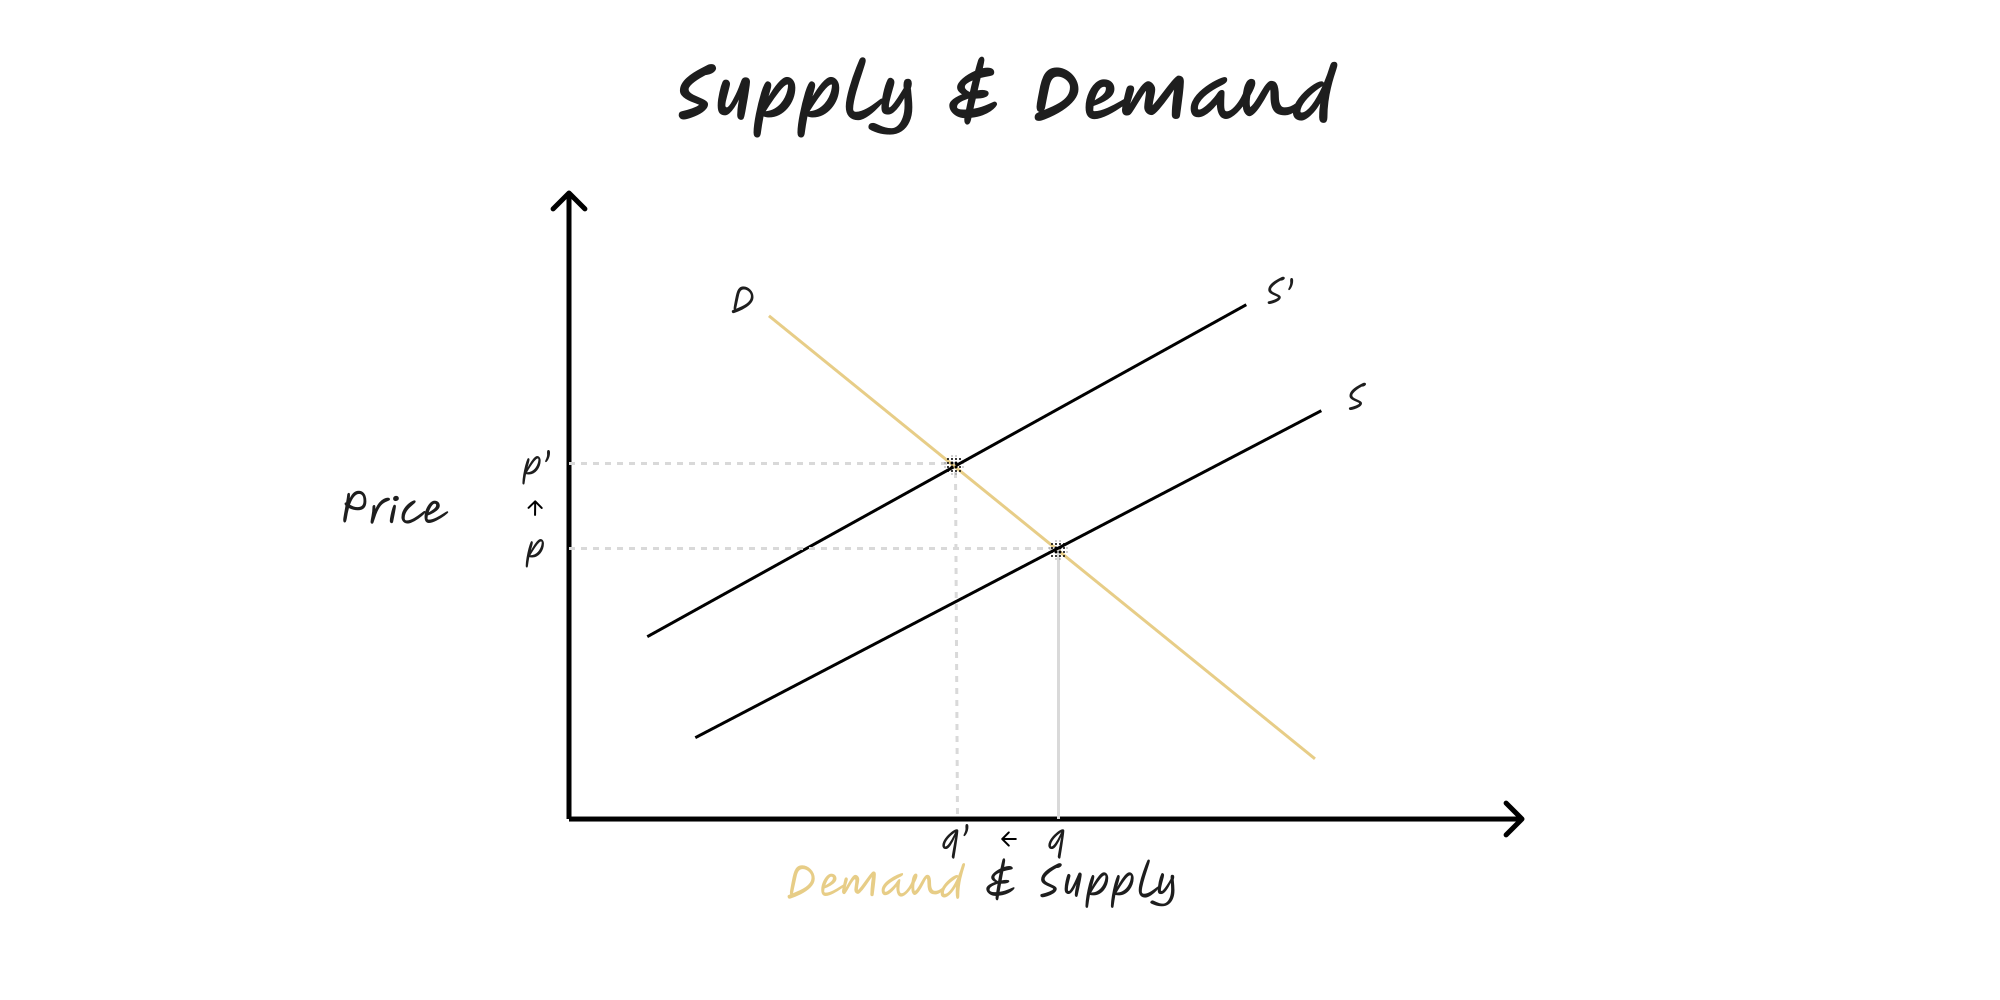
Prices and quantities are set by the interaction of willingness to buy and willingness to sell. Shifts in either curve change the equilibrium; elasticities determine how much price vs volume moves.
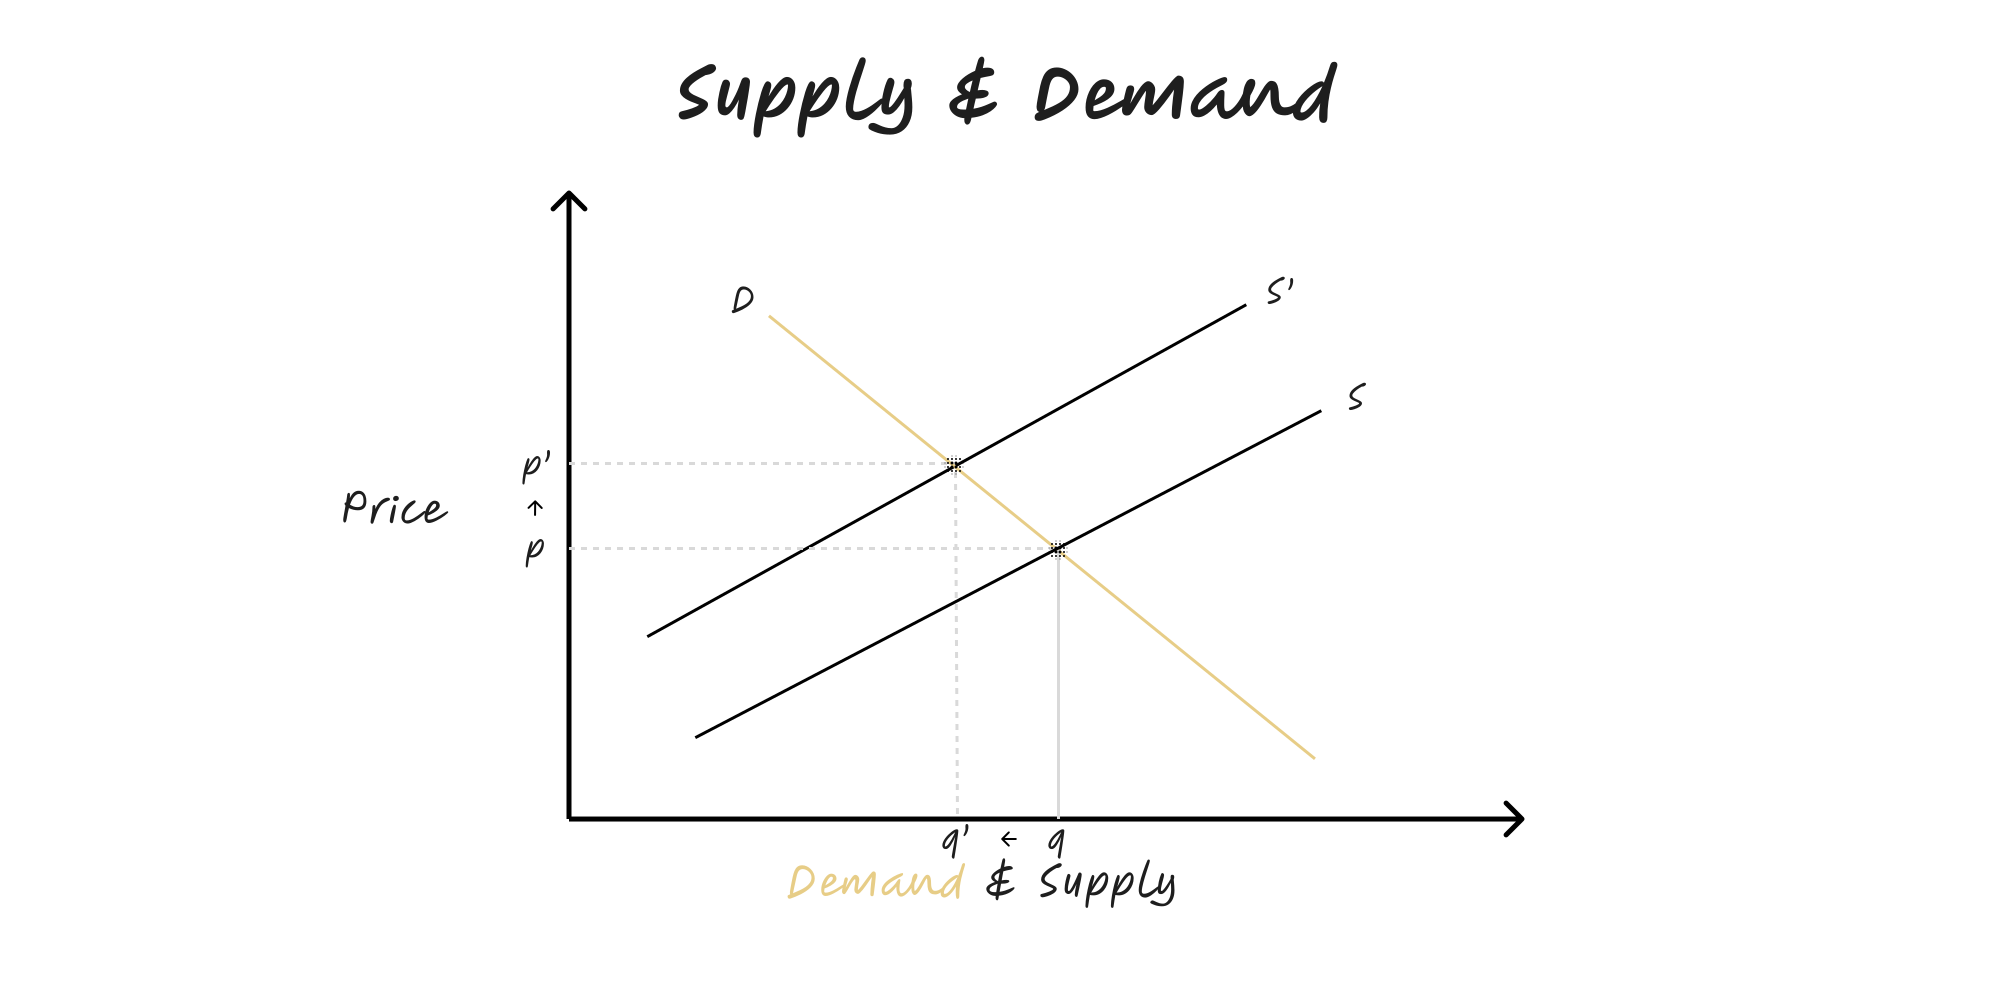
Supply and Demand
Prices and quantities are set by the interaction of willingness to buy and willingness to sell. Shifts in either curve change the equilibrium; elasticities determine how much price vs volume moves.
The Two Arrows
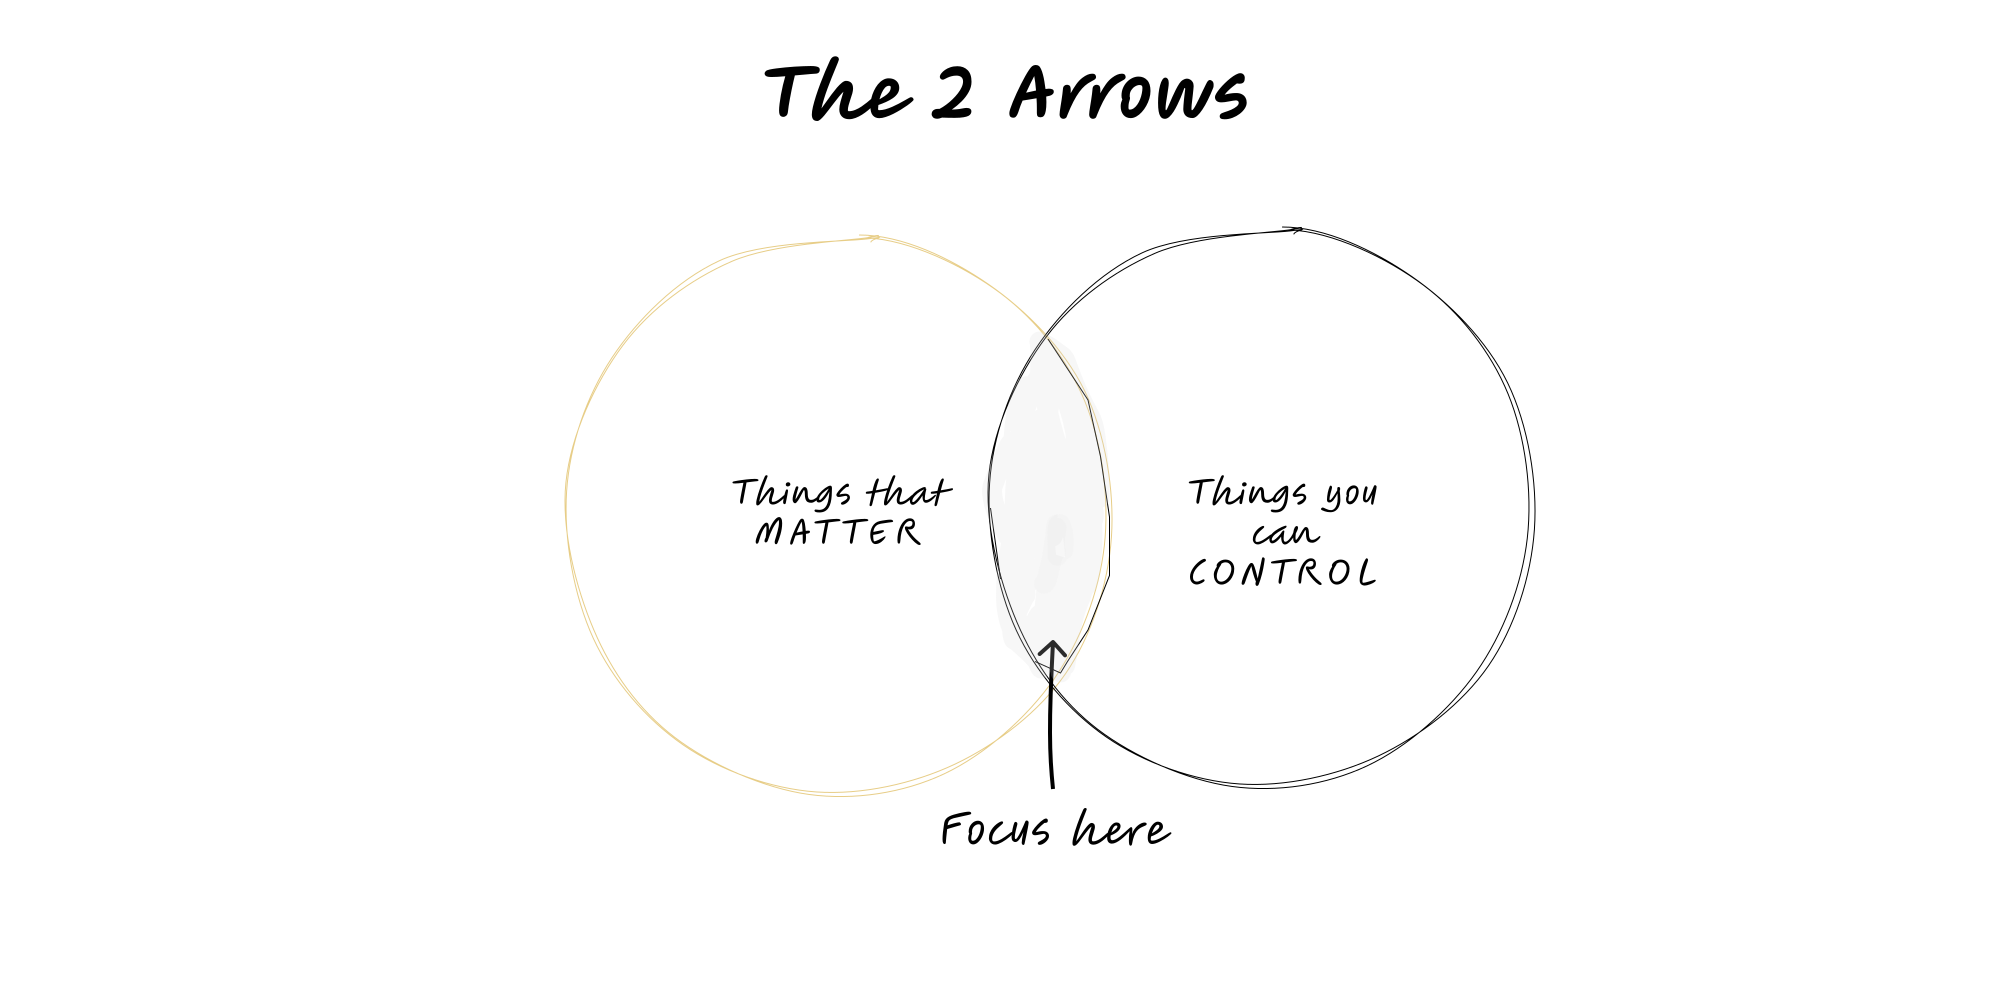
Focus where importance intersects with control. Act directly on what matters and you can change; influence or ignore the rest.
Deming’s 14 Points
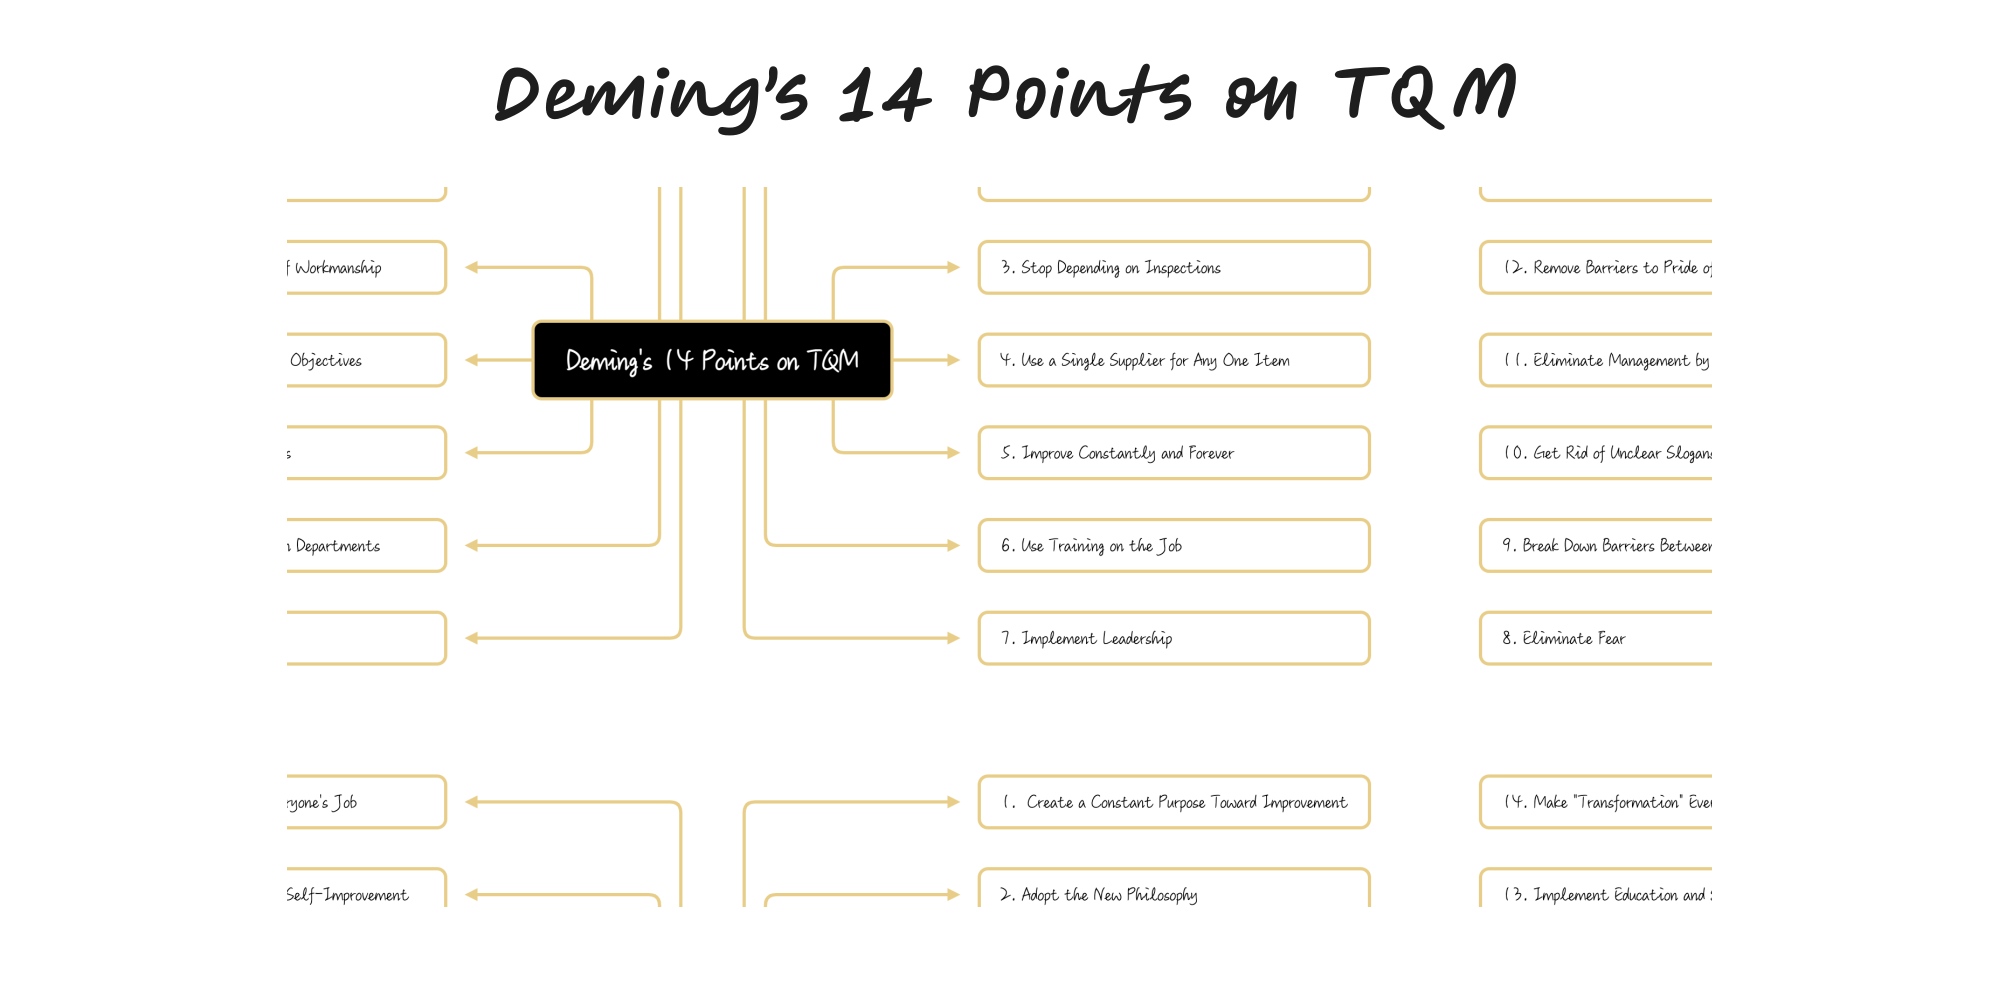
A management system for building quality into work by reducing variation, improving processes, and aligning everyone to long-term purpose.
Gall’s Law
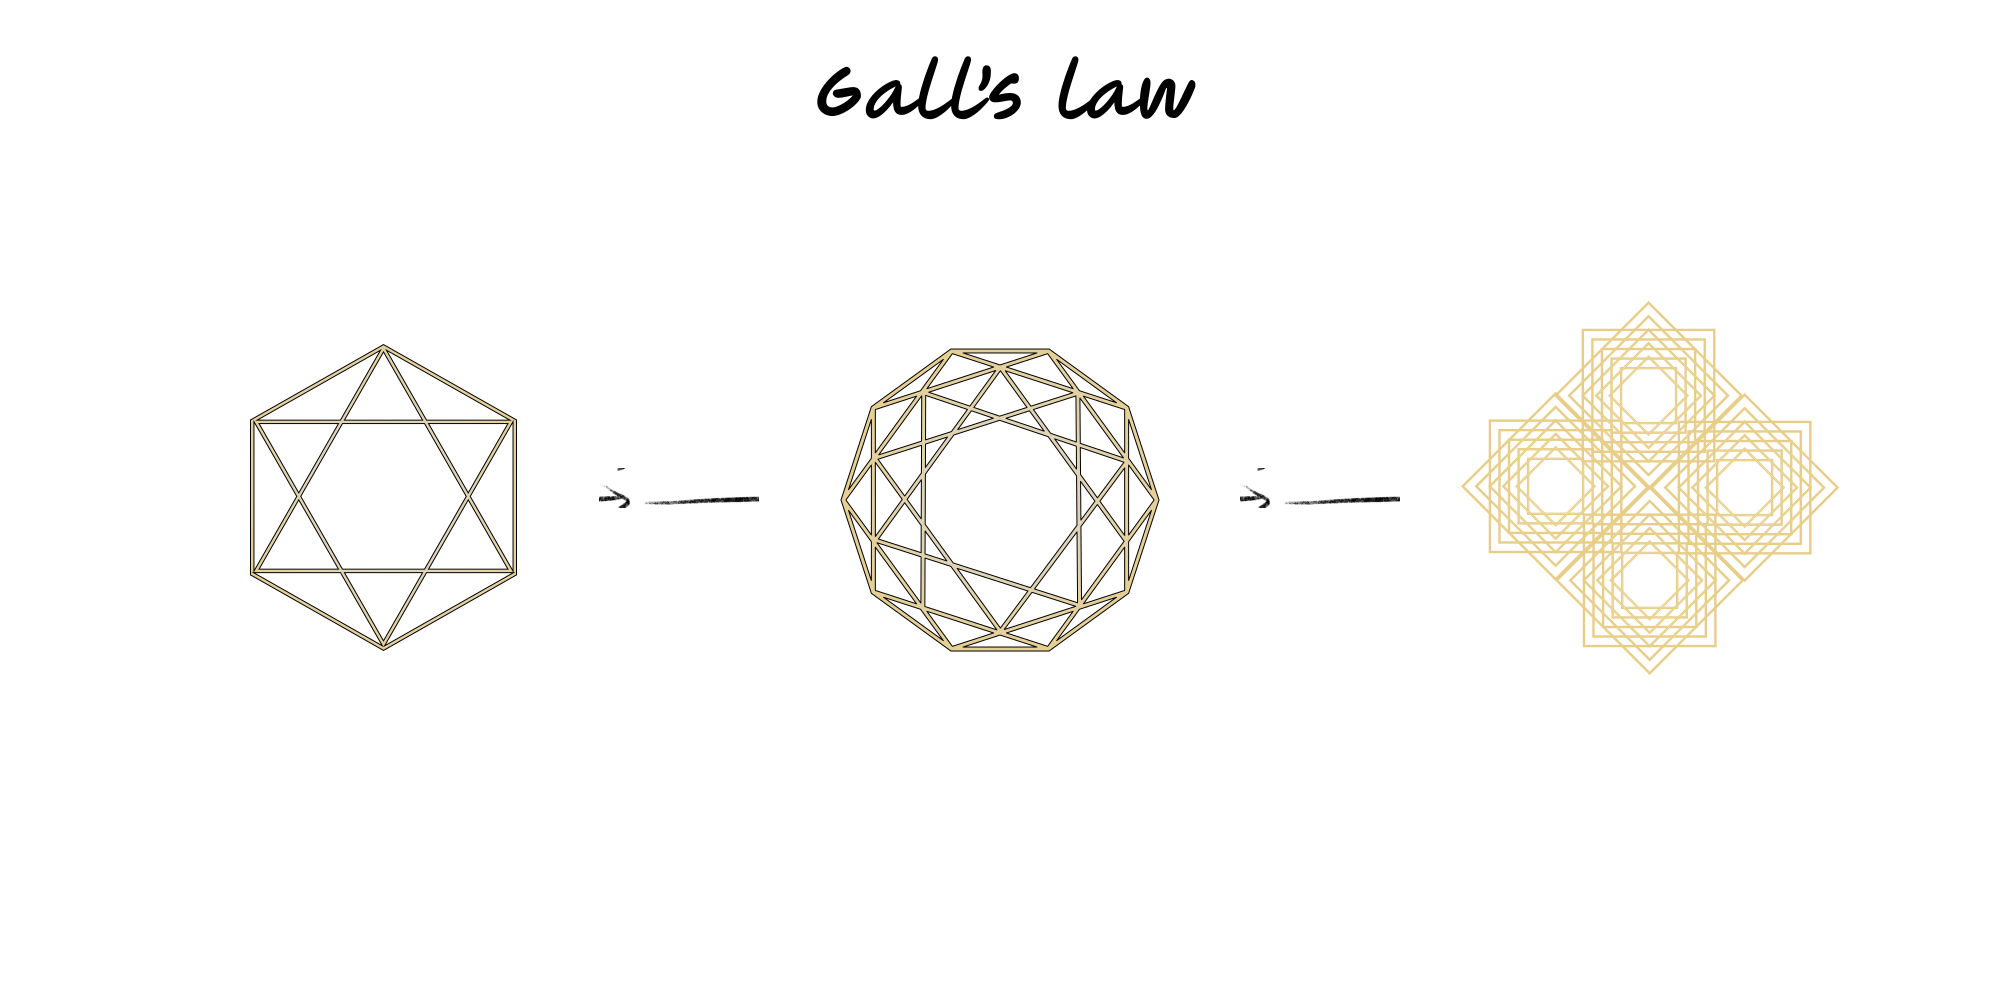
Complex systems that work evolve from simple systems that worked. Start small, get it working, then scale.
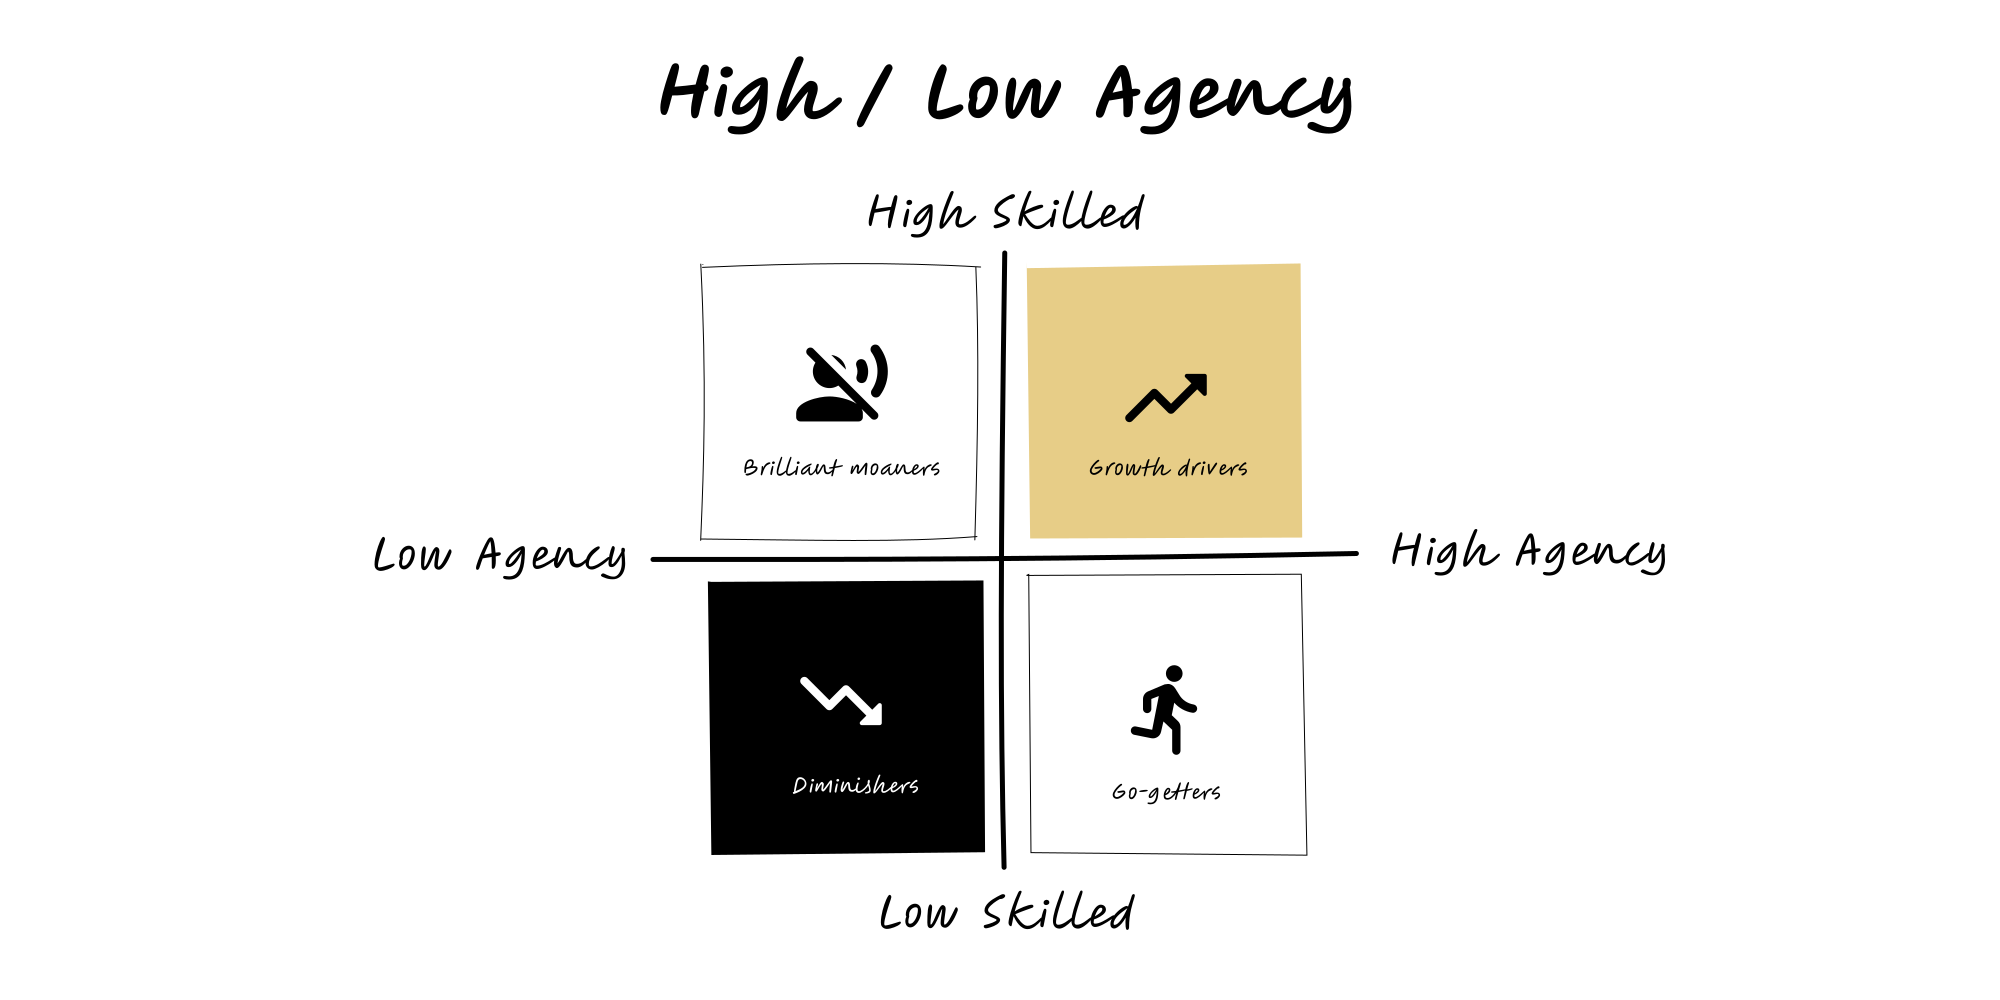
Agency (High / Low)
A practical lens for how people approach problems: low-agency waits for circumstances; high-agency creates options and moves first.
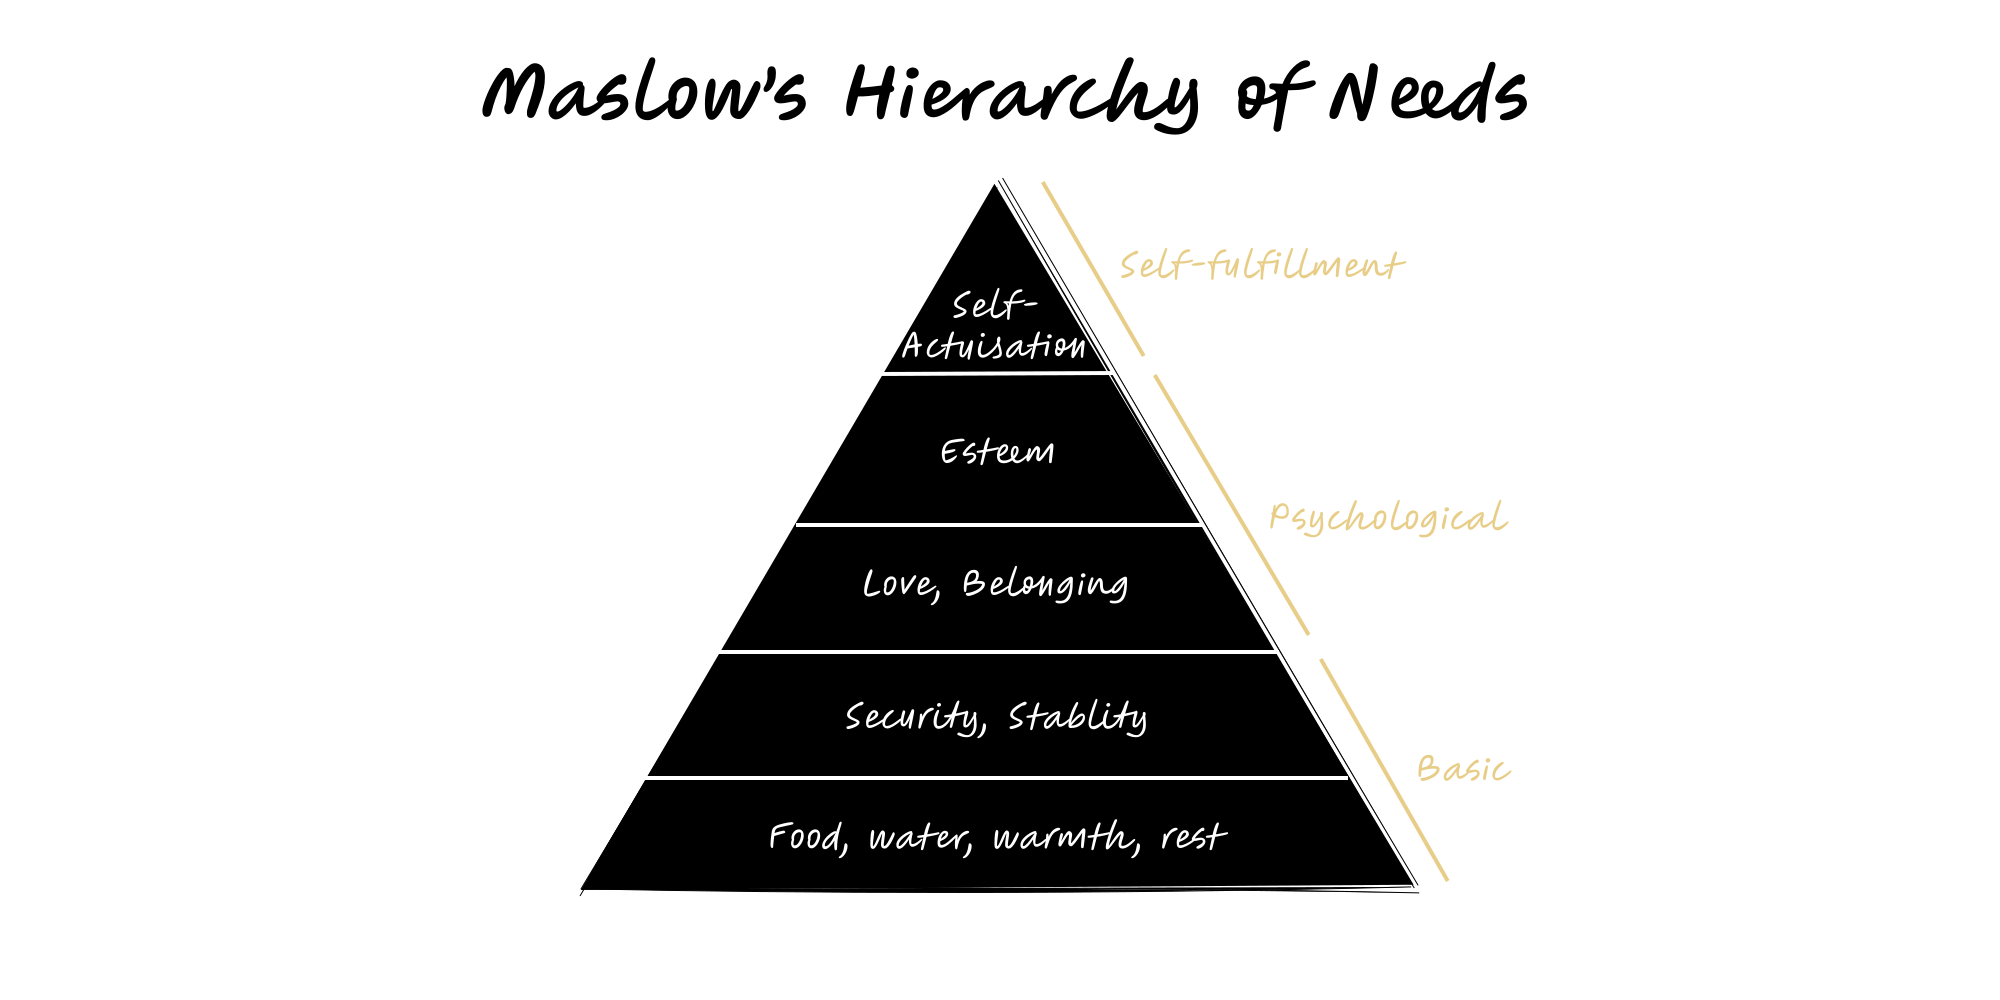
Maslow’s Hierarchy of Needs
A motivation heuristic: people prioritise unmet lower-order needs before higher ones. Use it to diagnose constraints and design incentives.
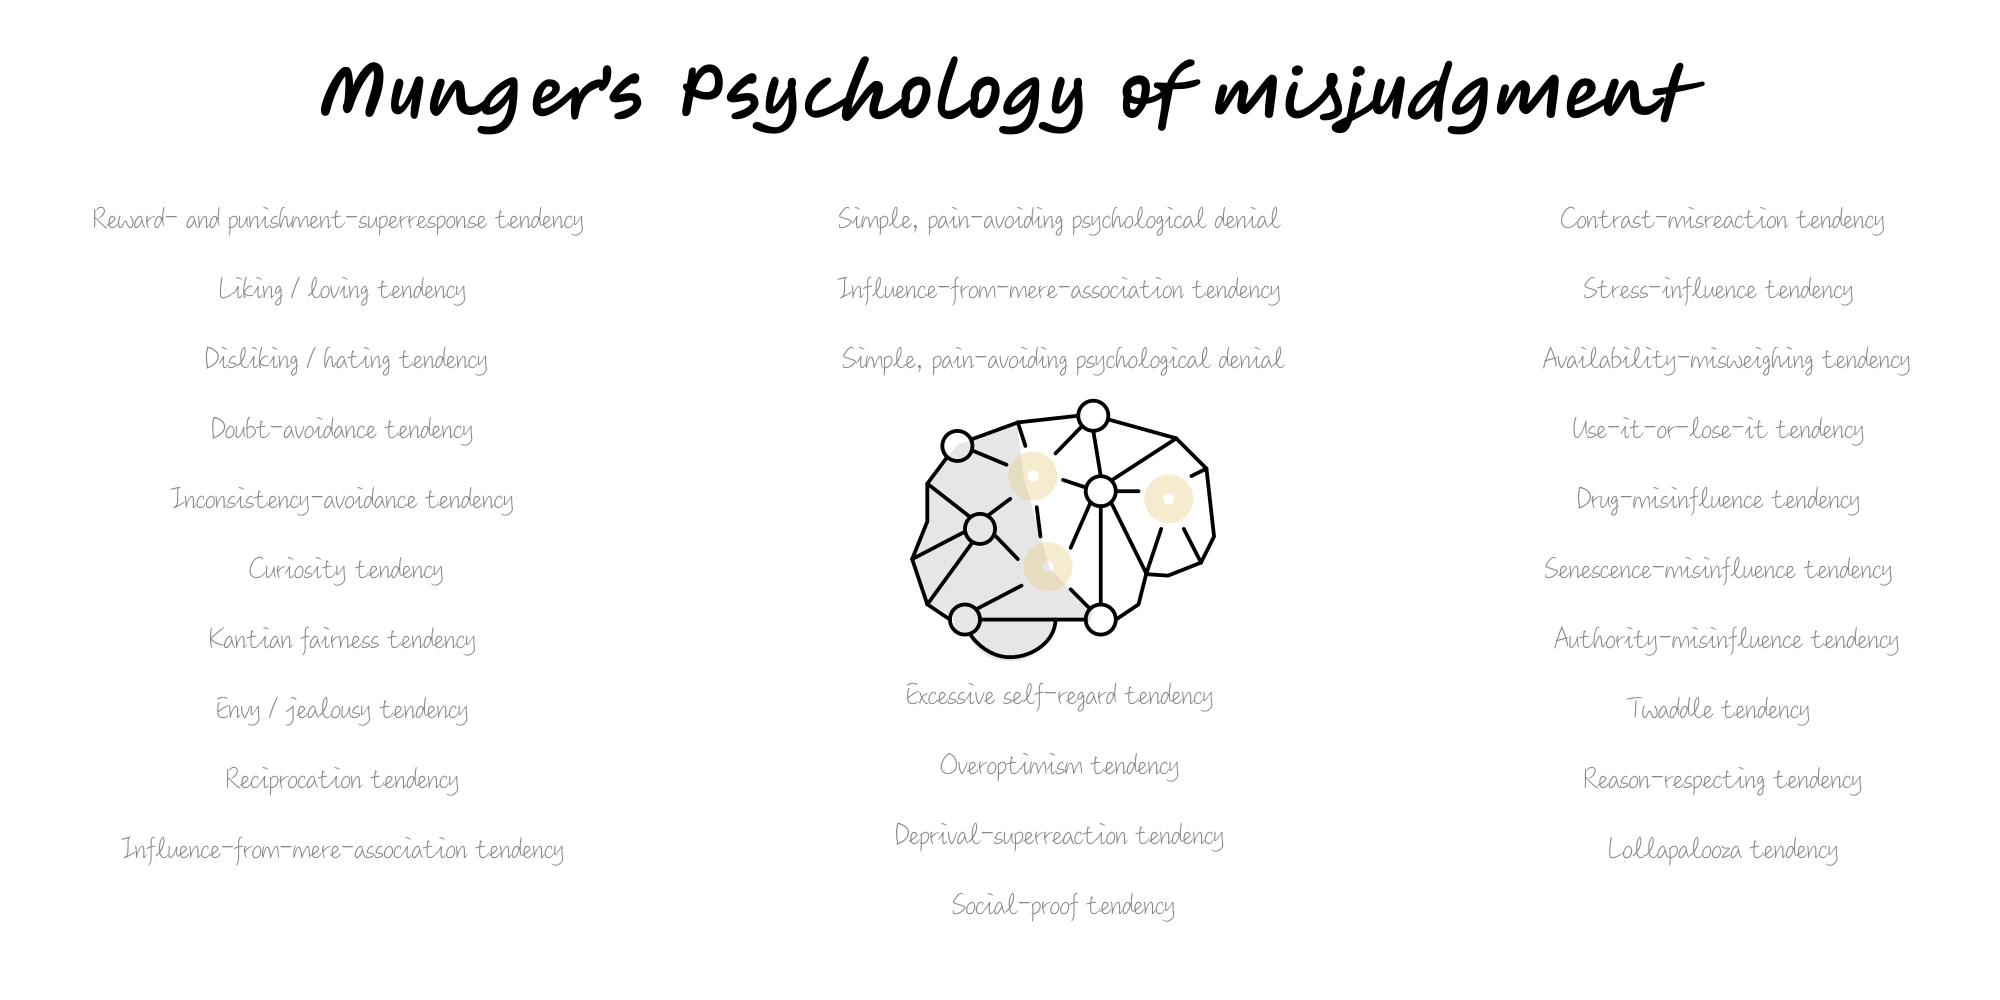
Munger’s Tendencies
Munger’s catalogue of 25 psychological tendencies that systematically distort judgement — and how to guard against them.
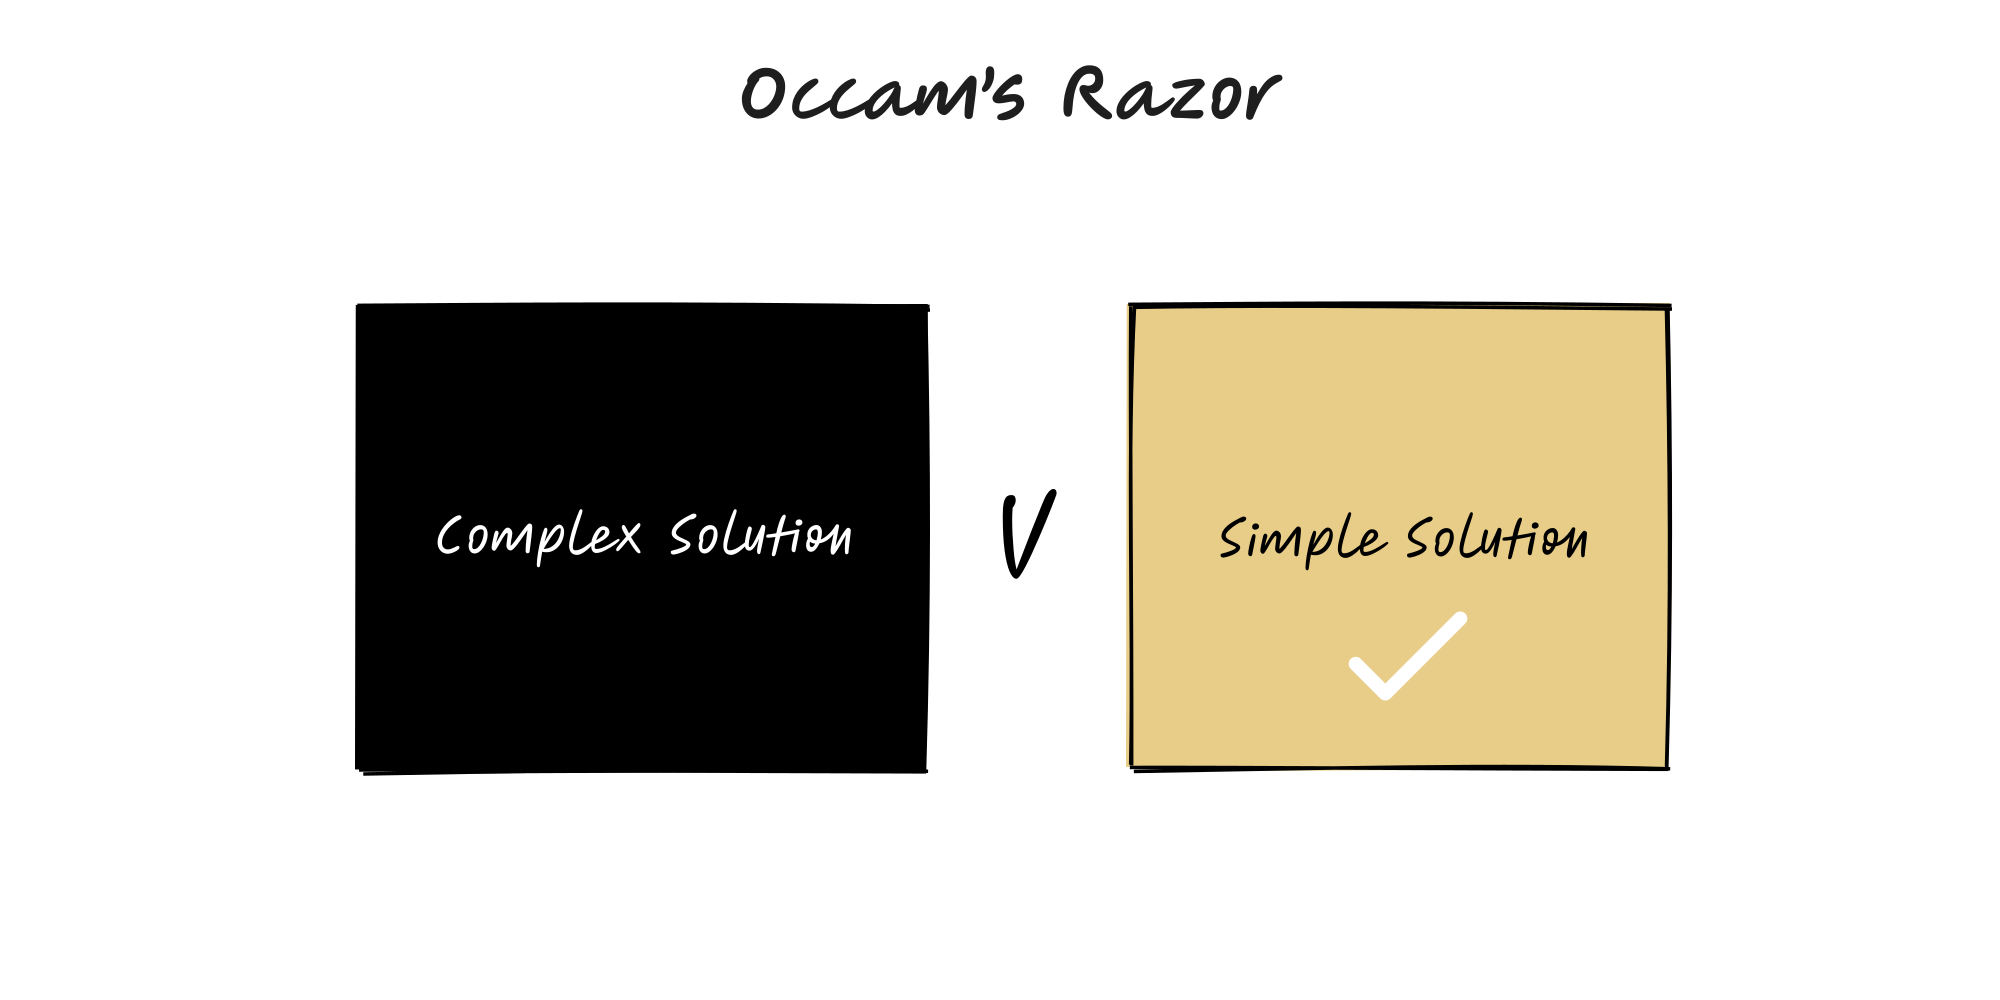
Occam’s Razor
When multiple explanations fit the evidence, prefer the one with the fewest necessary assumptions.
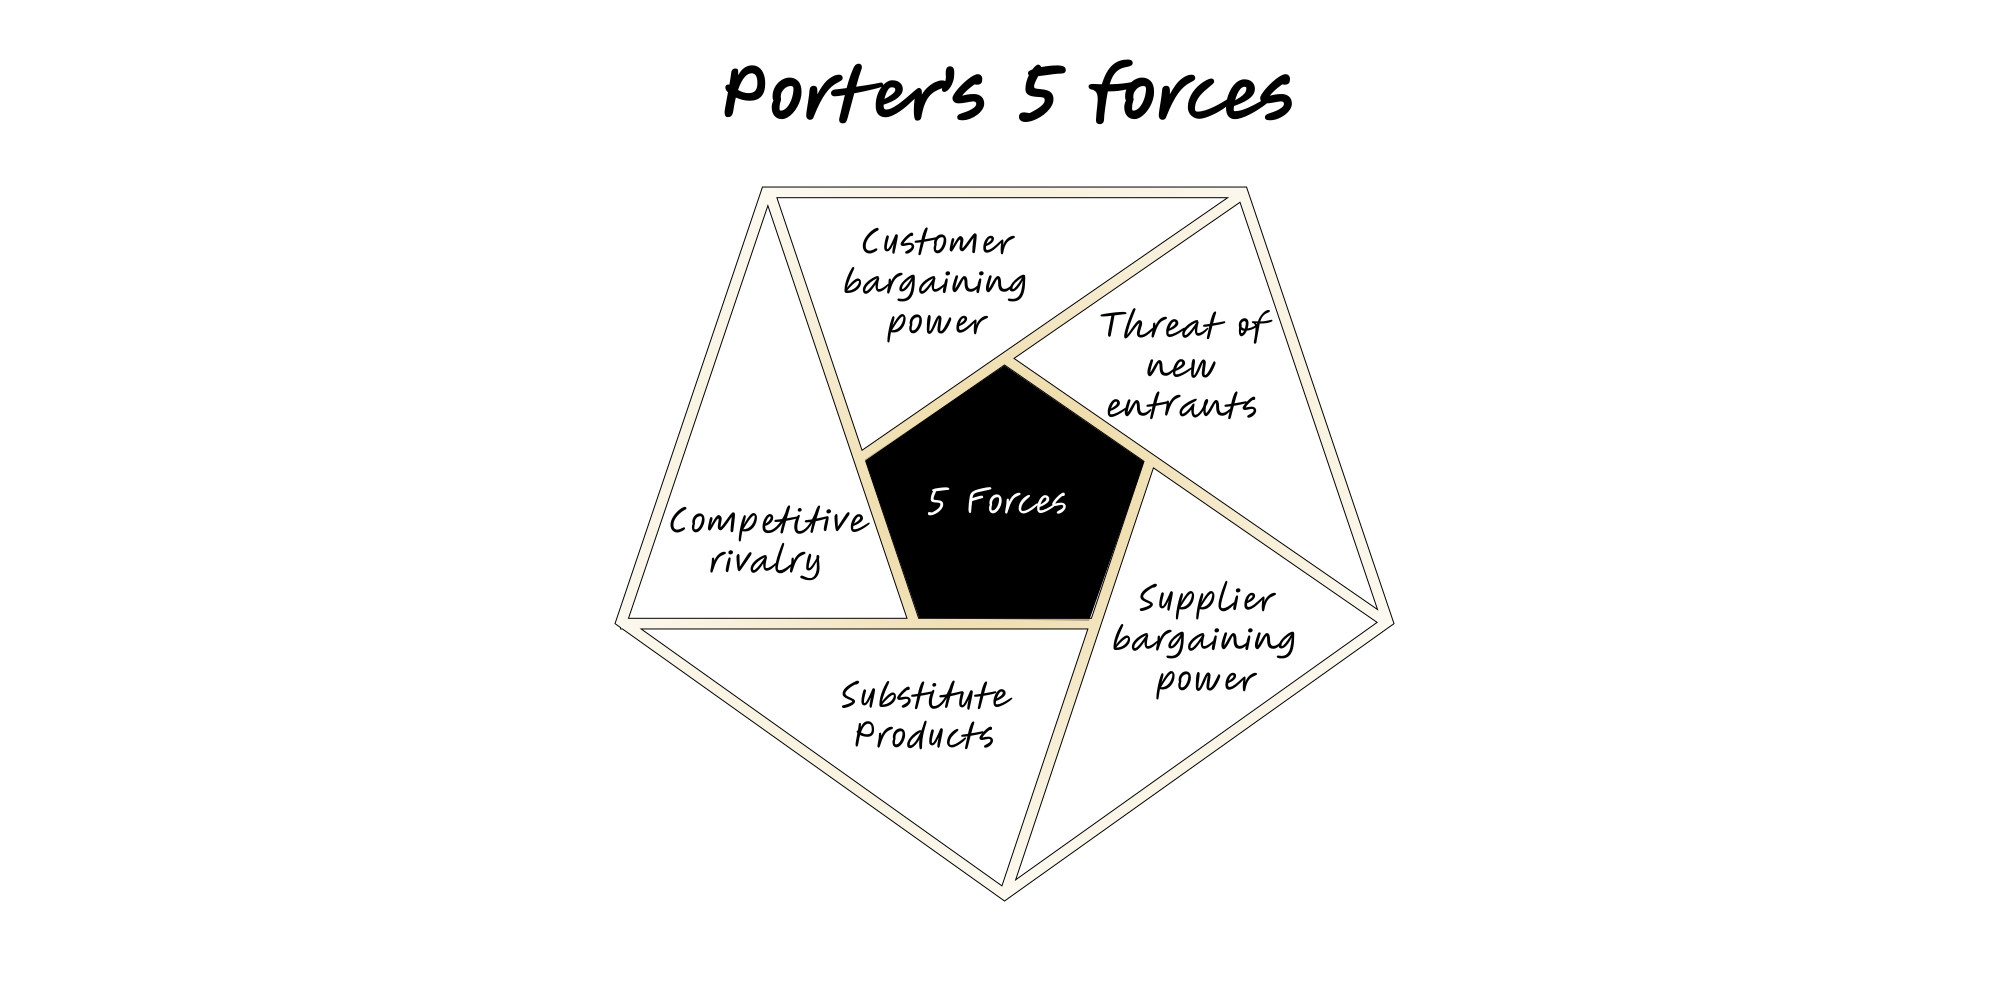
Porter’s Five Forces
A framework to assess industry structure and profit pools by evaluating five competitive forces and their drivers.
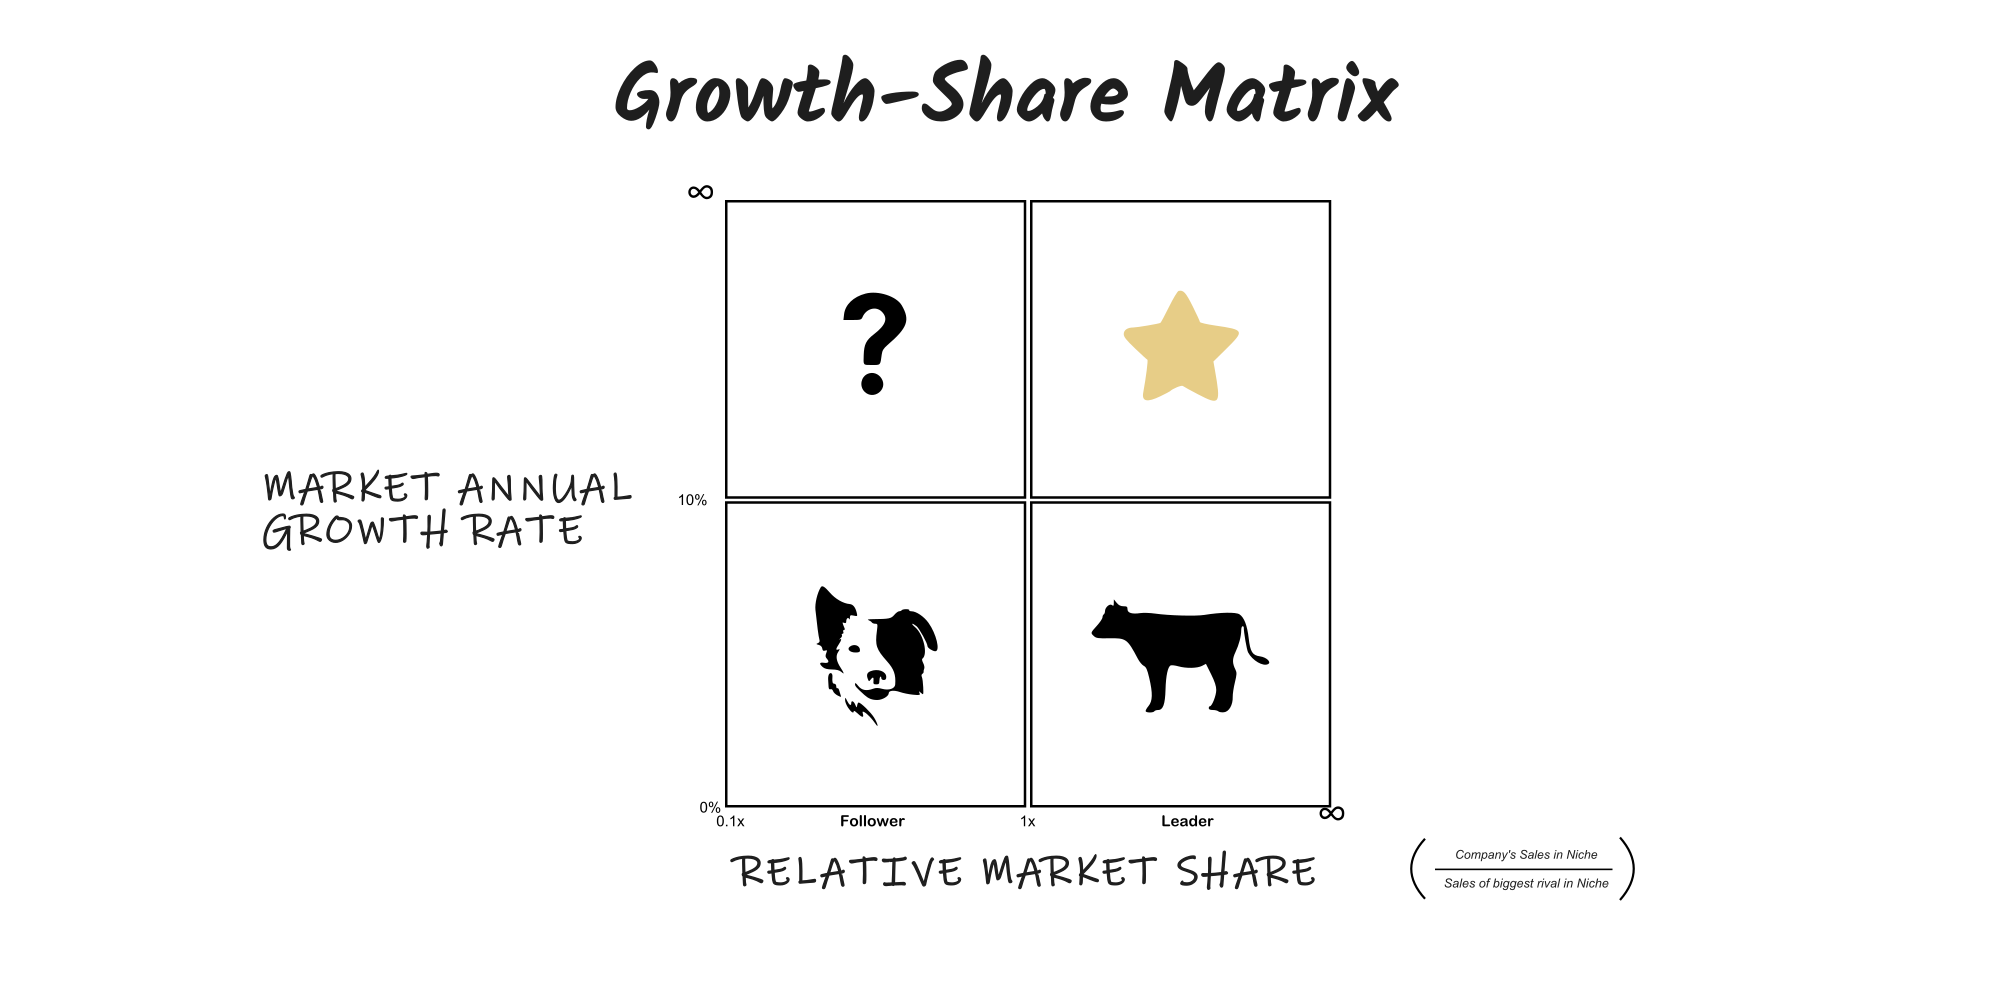
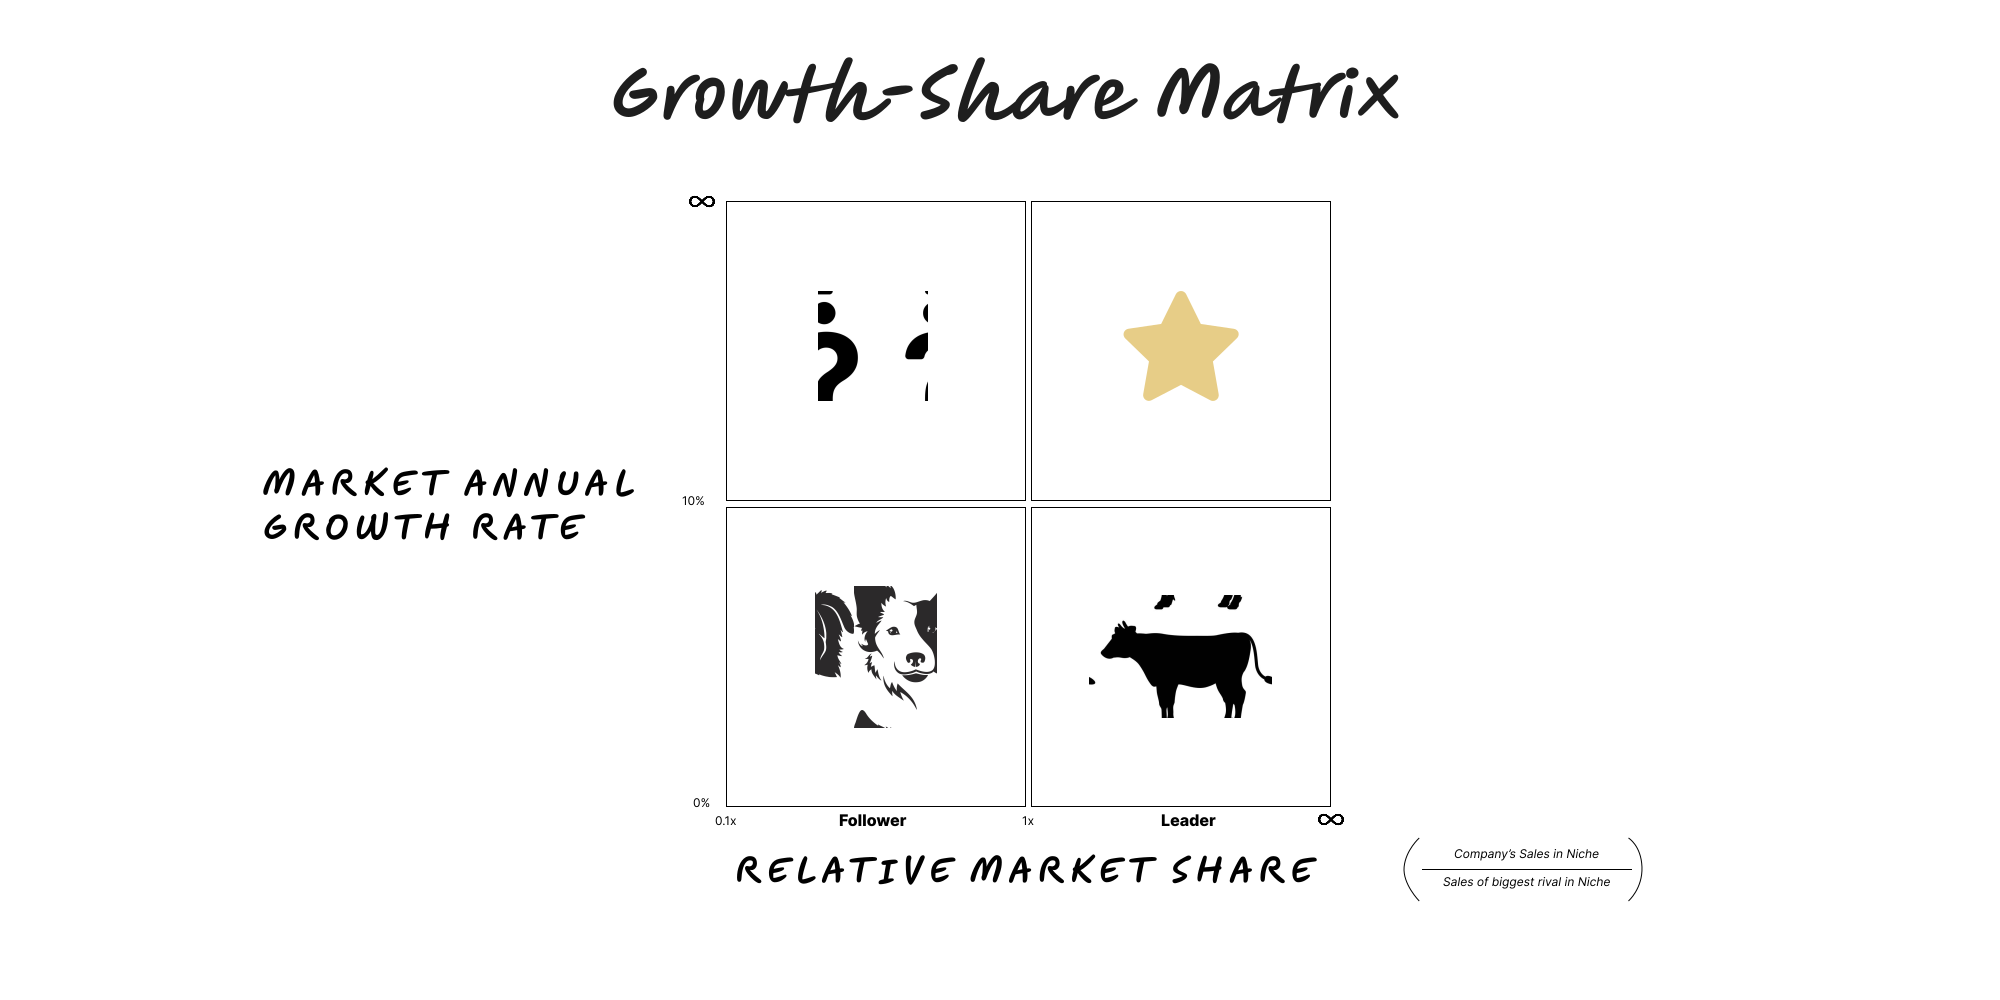
The Growth-Share Matrix
A portfolio tool from BCG that maps units by relative share and market growth to guide investment, harvest and exit decisions.